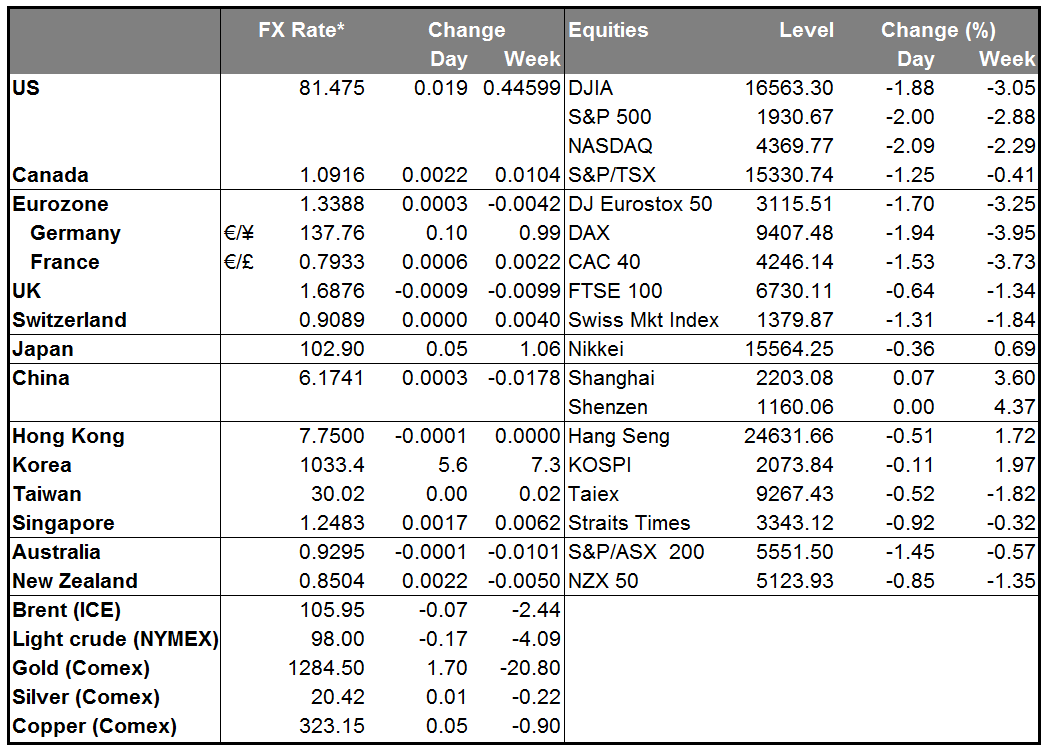
It looks like people are starting to come around to my view of what the FOMC minutes imply. Equities were down around the world while credit also suffered. Fed Funds expectations and bond yields initially rose, then fell back to trade lower as equities came off. In the US, the employment cost index rose 0.7% qoq in Q2, up sharply from 0.3% in Q1 and exceeding estimates of 0.5%. This is the highest rate of increase since the financial crisis of 2008 and made people think that perhaps there isn’t as much slack in the labor market as had been thought. Less slack in the labor market would mean earlier tightening by the Fed. It seems we are starting to repeat on a small scale what happened back in May 2013, when then-Fed Chairman Bernanke started to talk about ending the Fed’s quantitative easing program. Back then the dollar rose broadly against a wide variety of currencies. I would expect to see that performance repeated, although perhaps not quite on the same scale.
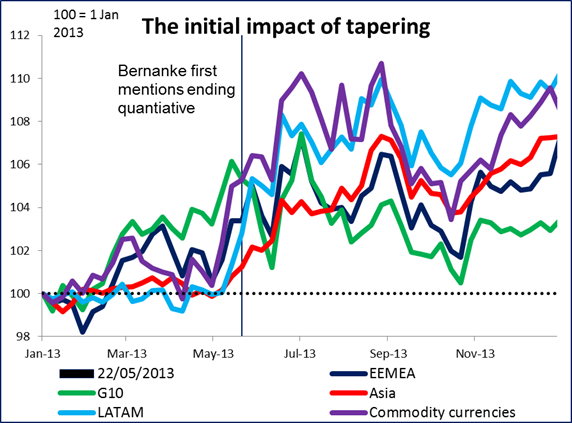
The dollar continued to gain all around even though US interest rates and rate expectations barely moved on the day. There was one big difference between yesterday and recent days, though, and that was the collapse of EM currencies. USD/EM had gained somewhat on Wednesday, but on Thursday the dollar just soared against almost every EM currency we track. It was up 1.7% vs IDR, 0.8% vs HUF, INR and BRL, 0.7% vs THB, etc. Oddly enough RUB held up relatively well; USD/RUB was up only 0.2%. We are seeing EM weakness rather than just USD strengthen as EUR/EM moved almost as much as USD/EM. The move have been in reaction to tightening expectations, as mentioned above, or it may have been due to the Argentinian default, which adds to the Russian sanctions to remind investors of the potential risks in the EM world. (Although let’s not forget that several Eurozone countries were near default recently, too. People with carry trades on should be careful as these sorts of carry trade unwinds can go on for some time. Over the longer term I would expect EM to bounce back, as the yield gap is quite attractive with Eurozone yields at record lows, but caution is warranted for now.
China’s official manufacturing PMI for July increased more than expected, rising to 51.7 from 51.0 (market expectation: 51.4). The final manufacturing PMI for July from HSBC/Markit on the other hand was revised down slightly to 51.7 from 52.0. AUD/USD initially spiked when the former number came out, then plunged ahead of the latter. It’s now trading lower, which implies that the market believes HSBC/Markit more.
Today: It’s a PMI day in Europe as well. The day starts with the manufacturing PMI figures for July from several European countries, the Eurozone as a whole, the UK and later on, the US. As usual, the final forecasts for the French, the German and Eurozone’s figures are the same as the initial estimates. The UK manufacturing PMI is estimated to be slightly down to 57.2 from 57.5, which could add to the negative sentiment towards GBP, while in the US, the ISM manufacturing PMI is expected to have risen to 56.0 from 55.3, which could prove USD-supportive.
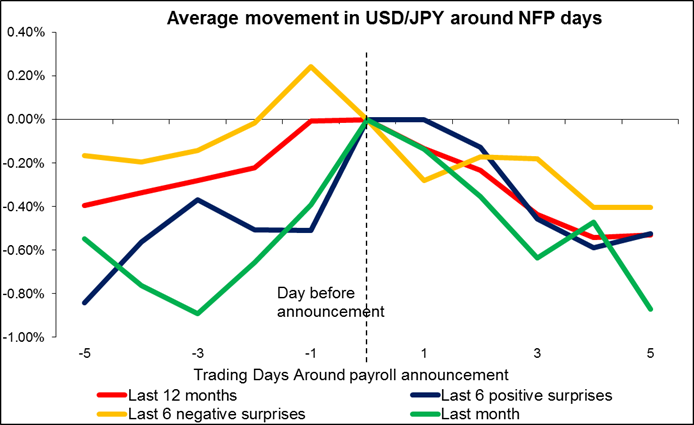
The main event though will be the US nonfarm payrolls for July. The market consensus is for payrolls to rise by 231k vs 288k in June. A strong NFP reading, along with an anticipated unchanged near six-year low unemployment rate of 6.1%, should add to the recent solid US data and boost USD further. As usual, I recommend that anyone wanting to take a position ahead of the figures should express their view in USD/JPY, which tends to react more on NFP days than EUR/USD. Although I must note that on average, over the last year USD/JPY has been lower a week after the NFP than it was immediately before the figure regardless of whether the figure beat or missed expectations! In fact USD/JPY was lower a week later the last six times. The pattern seems to have been that USD strengthens going into the figure on expectations that it will change the market’s view entirely, but then when it doesn’t, prices revert to where they were earlier. I hesitate to say that “this time is different,” but I think this time at least the NFP figure only has to corroborate market thinking, not change market thinking, in order to keep USD rallying.
We also get from the US personal income and personal spending for June, which are expected to have accelerated. On the other hand, the yoy rate of increase in the PCE deflator and core PCE are forecast to have decelerated a bit, contrary to the sharp acceleration in the Q2 core PCE in Wednesday’s GDP figures. The core PCE is forecast to have slowed to 1.4% yoy from 1.5% yoy. The final U of Michigan consumer confidence sentiment for July is also coming out.
The Market
EUR/USD quiet ahead of the NFPs
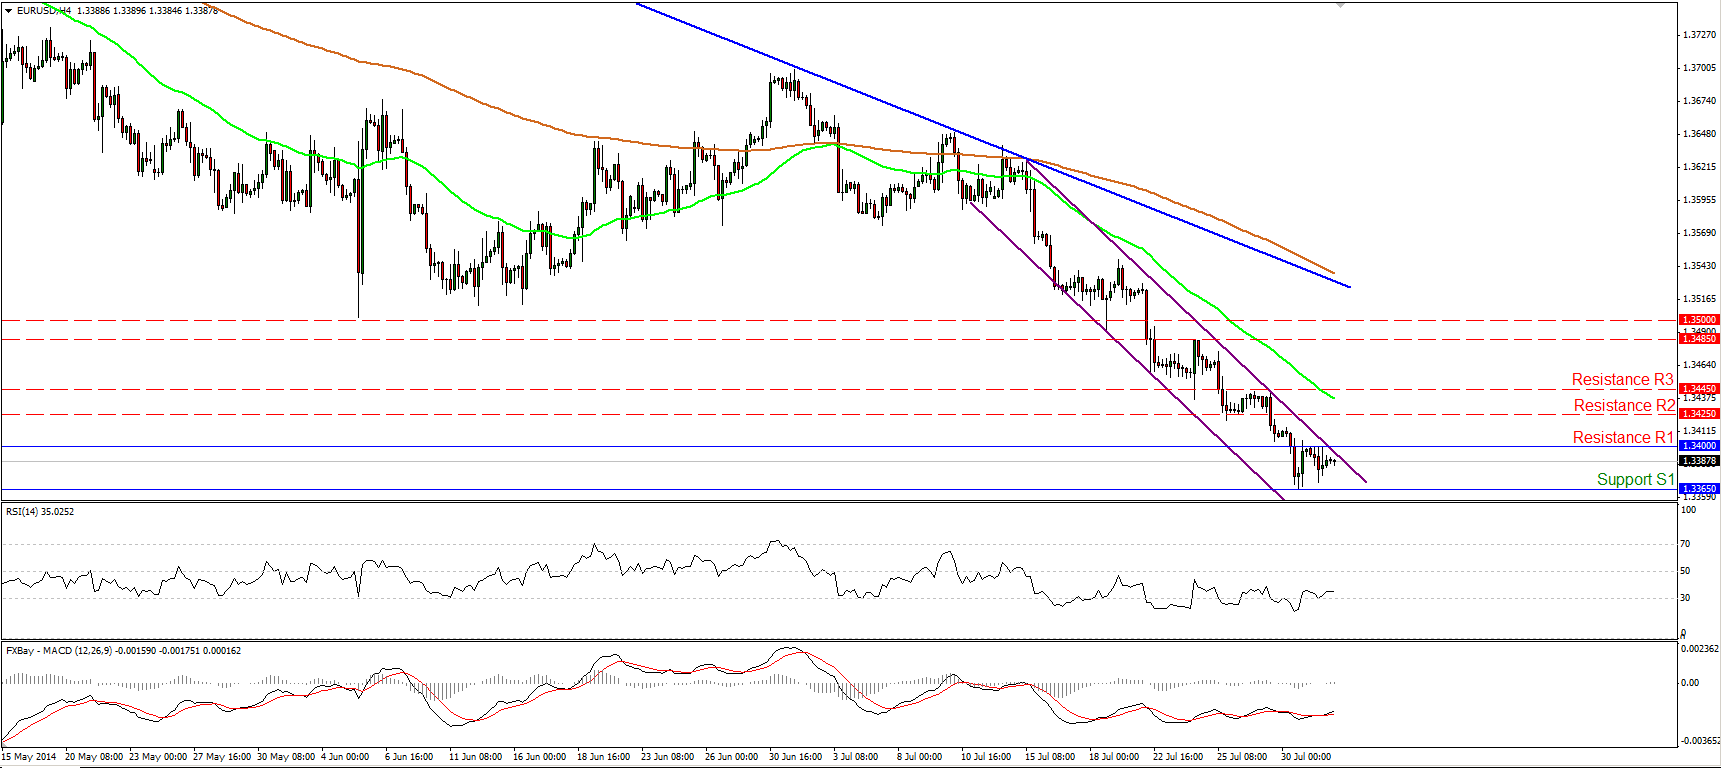
EUR/USD moved in a consolidative mode on Thursday, remaining between the support level of 1.3365 (S1) and the key resistance of 1.3400 (R1). I still see a short-term downtrend on the 4-hour chart and a clear move below the 1.3350/65 zone could drive the rate towards the next support barrier at 1.3300 (S3). Nevertheless, much of today’s movement will depend on the US employment data coming out later in the afternoon. On the daily chart, I see lower highs and lower lows below the 50- and the 200- day moving averages, with the former being below the later one and pointing down. This keeps the long-term path of EUR/USD to the downside.
• Support: 1.3365 (S1), 1.3350 (S2), 1.3300 (S3).
• Resistance: 1.3400 (R1), 1.3425 (R2), 1.3445 (R3).
USD/JPY remains elevated.
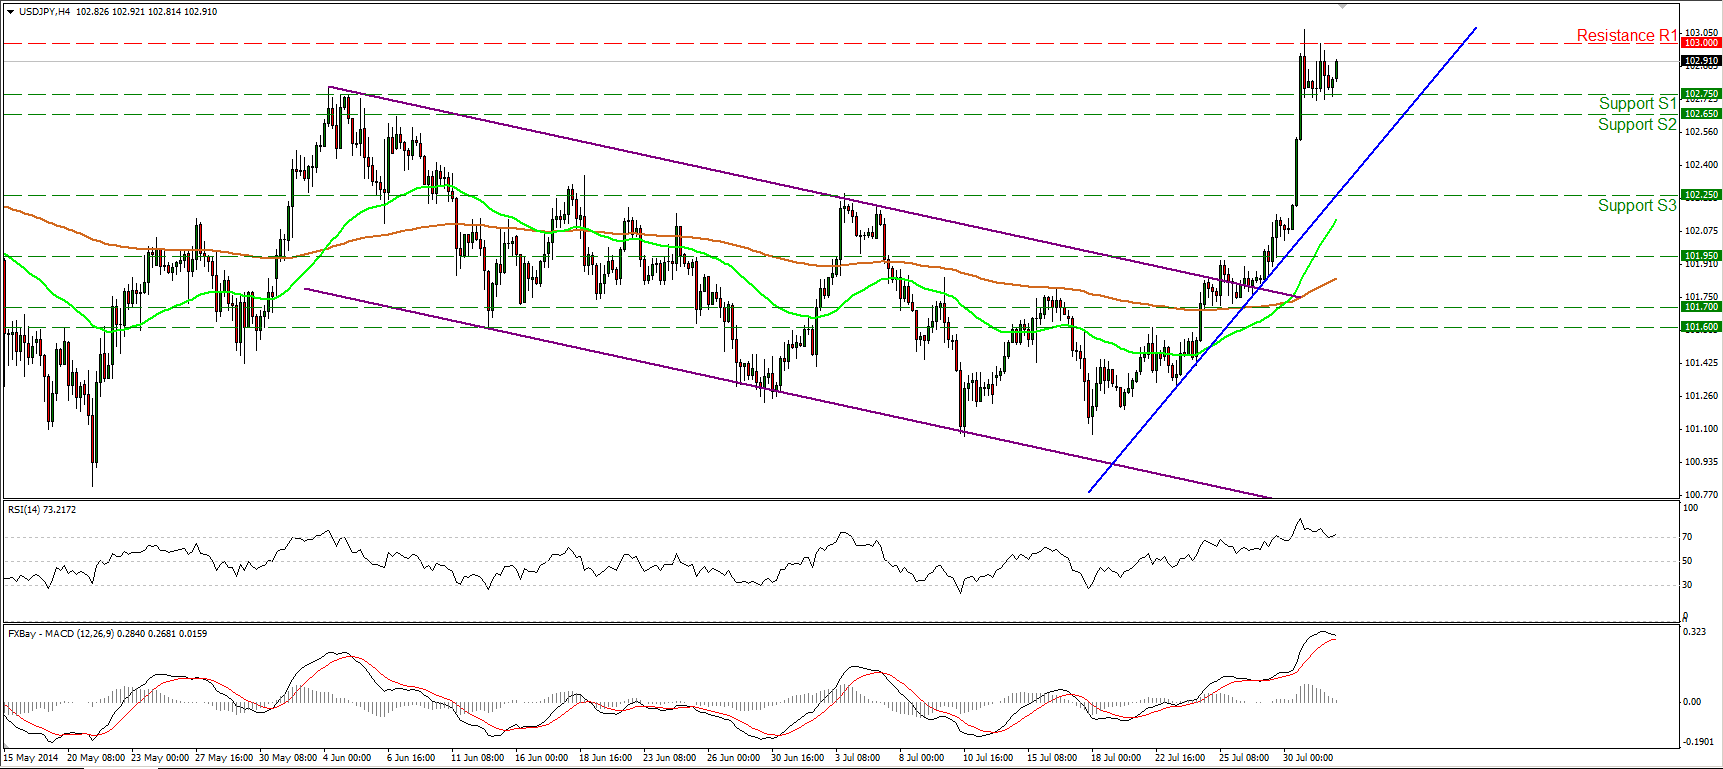
USD/JPY climbed on Wednesday, violating three resistance barriers in a row and hitting the resistance zone of 103.00 (R1). On Thursday, the rate moved in a consolidative mode, remaining below the 103.00 (R1) bar and above our support of 102.75 (S1). The outlook remains positive and a clear break above 103.00 (R1) will perhaps trigger extensions toward the next obstacle at 103.40 (R2). I would ignore the overbought reading of the RSI, as the indicator found support at its 70 line and is now pointing up. On the 1-hour chart, the 14-hour RSI rebounded from its 50 level, while the hourly MACD, already positive, looks willing to move above its signal line. This corroborates my view for further upside in the near future.
• Support: 102.75 (S1), 102.65 (S2), 102.25 (S3).
• Resistance: 103.00 (R1), 103.40 (R2), 104.15 (R3).
EUR/GBP somewhat higher
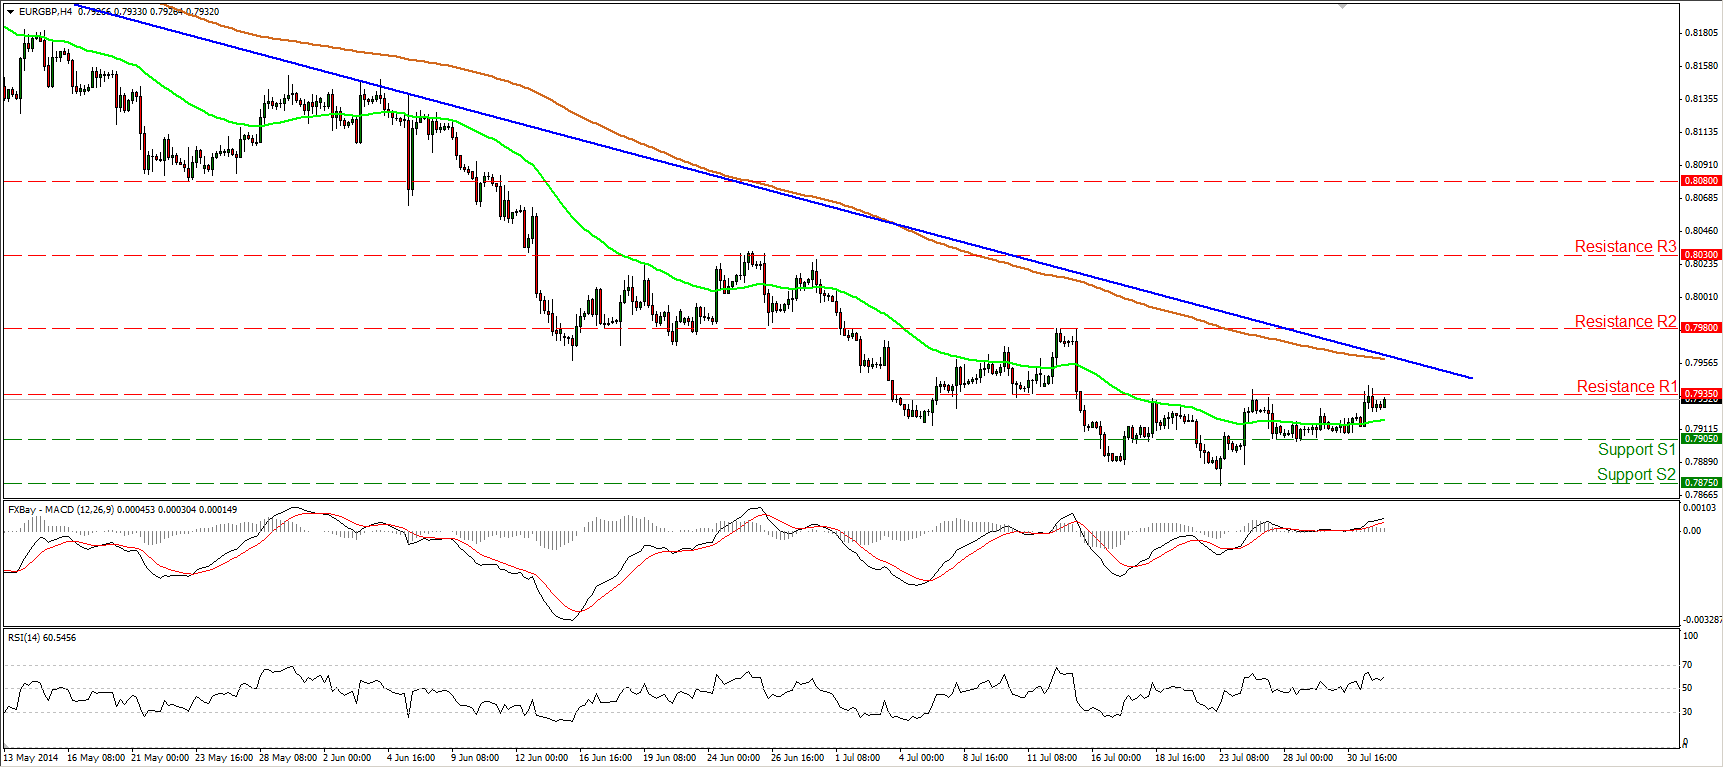
EUR/GBP moved somewhat higher to reach the resistance zone of 0.7935 (R1). Although the overall trend remains to the downside (marked by the downtrend line drawn from back the 11th of April), the positive divergence between our daily momentum studies and the price action remains in effect, confirming the bears’ lack of momentum. The rate continues to confirm my view that this trend is not the best to rely on as it is likely to be at its latest stages. I would regain my confidence on the downtrend upon a dip below 0.7875 (S2). Such a dip would confirm a forthcoming lower low and could trigger extensions towards 0.7815 (S3).
• Support: 0.7905 (S1), 0.7875 (S2), 0.7815 (S3).
• Resistance: 0.7935 (R1), 0.7980 (R2), 0.8030 (R3).
Gold breaks below 1290
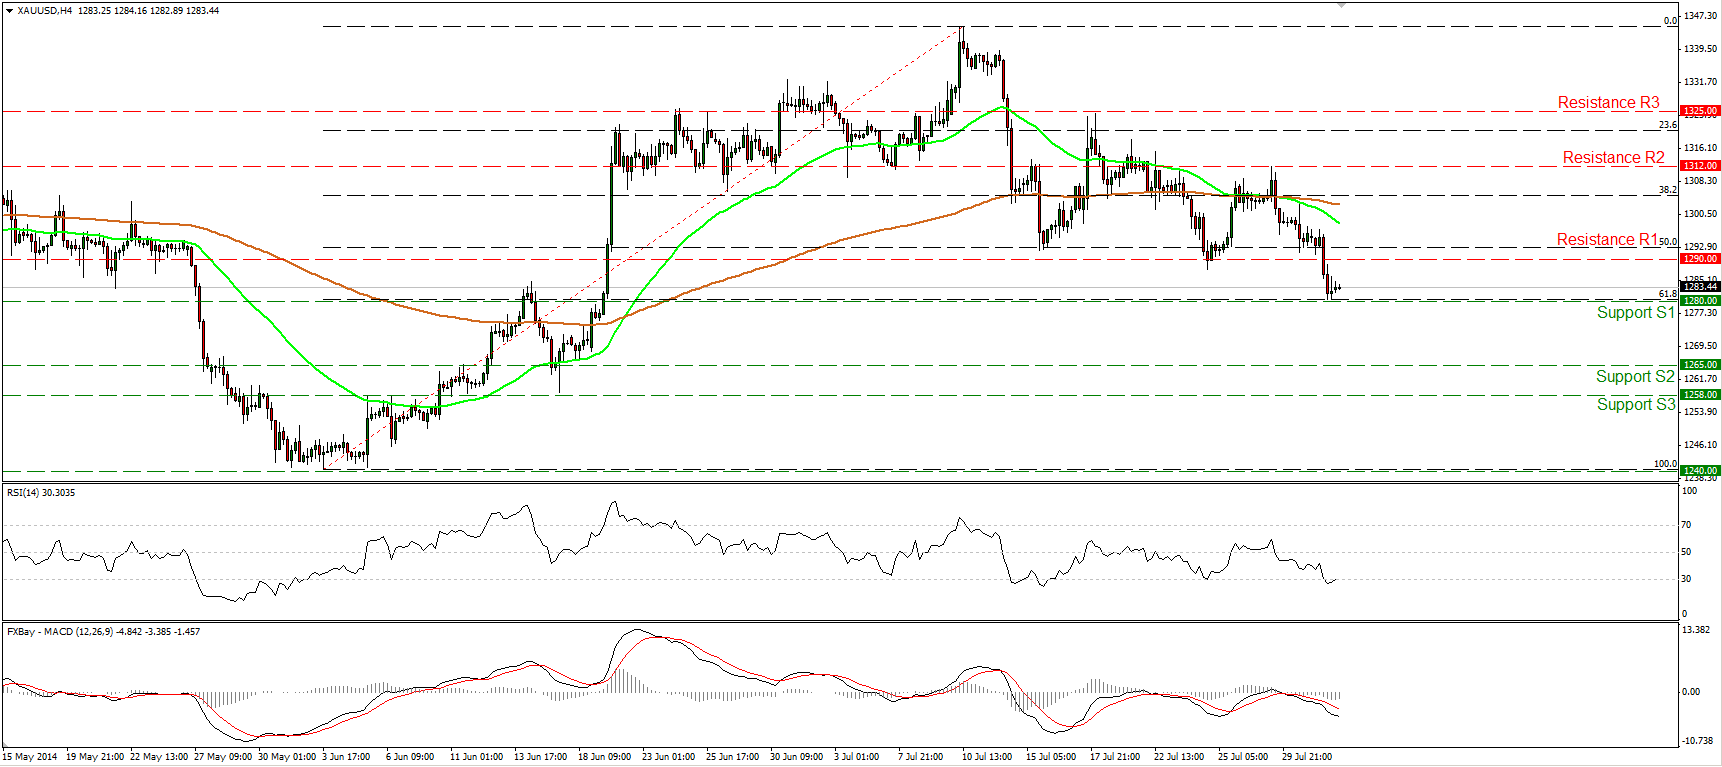
Gold tumbled yesterday, breaking below the support zone of 1290 and finding support at the 61.8% retracement level of the 3rd June – 10th July uptrend, at 1280 (S1). Such a move confirms a forthcoming lower low and shifts the outlook cautiously to the downside. A decisive dip below the 1280 barrier is likely to have larger bearish implications and could target the next support zone at 1265 (S2). On the daily chart, the 14-day RSI moved lower after finding resistance at its 50-line, while the daily MACD, already below its trigger line, turned negative, indicating negative momentum for the yellow metal.
• Support: 1280 (S1), 1265 (S2), 1258 (S3).
• Resistance: 1290 (R1), 1312 (R2), 1325 (R3) .
WTI keeps falling
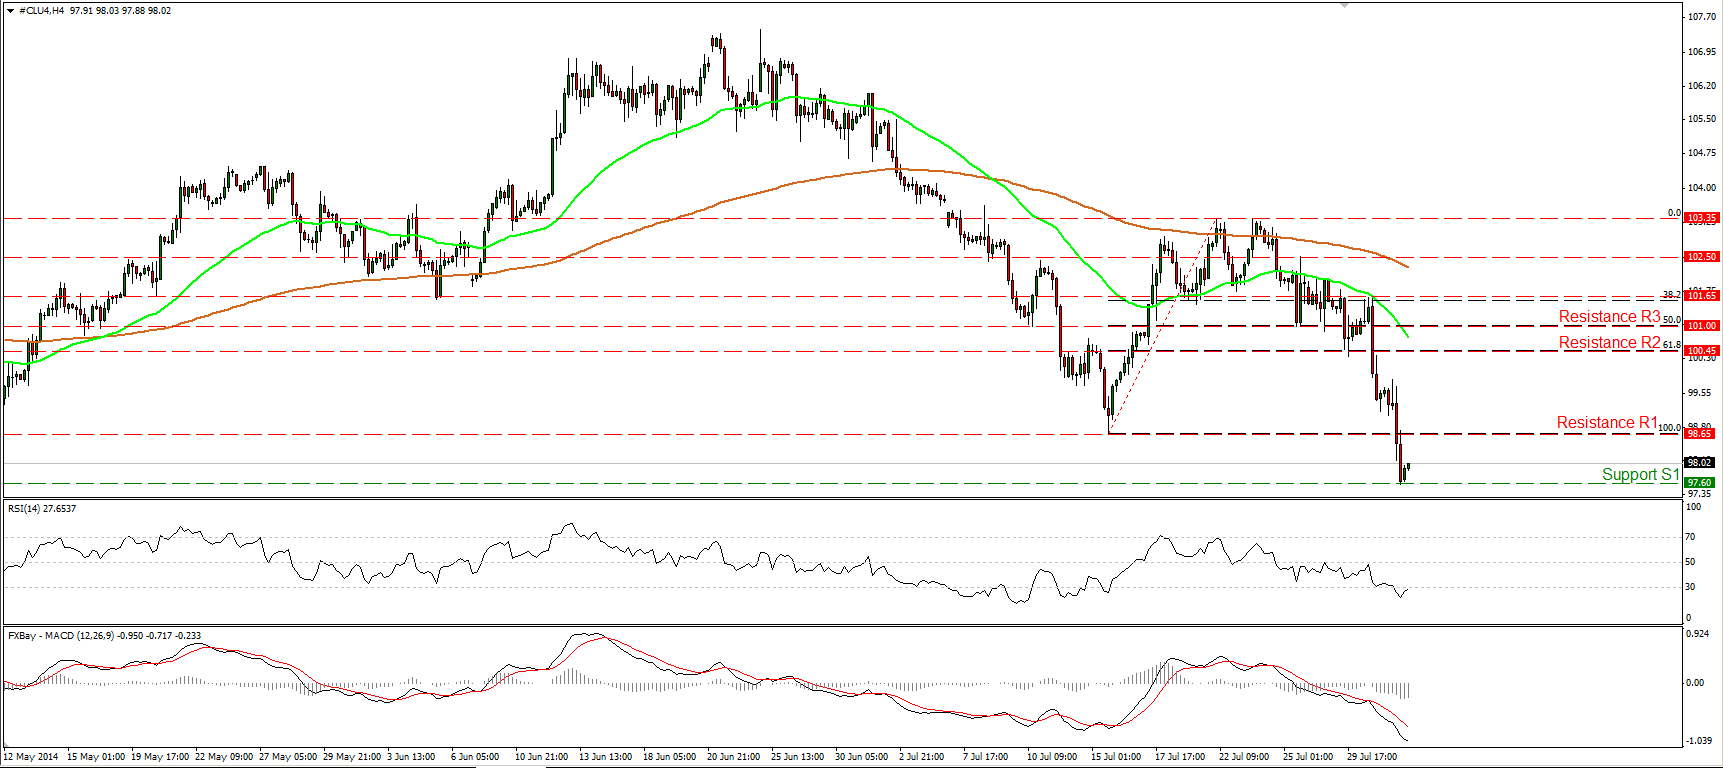
WTI continued falling on Thursday, breaking below the lows of the 15th of July at 98.65. The price found support at 97.60 (S1). Although the picture remains negative, I feel that the decline was too steep and change my view to flat for today. I would like to see a dip below 97.00 (S2) before expecting the continuation of the downtrend. Such a dip could pave the way towards the zone of 95.85 (S3). Zooming on the 1-hour chart, the 14-hour RSI moved out from its oversold field and is now pointing up, while the hourly MACD has bottomed and is now ready to cross above its signal line. As a result I would expect another run of short-covering near 97.60 (S1).
• Support: 97.60 (S1), 97.00 (S2), 95.85 (S3).
• Resistance: 98.65 (R1), 100.45 (R2), 101.00 (R3).

