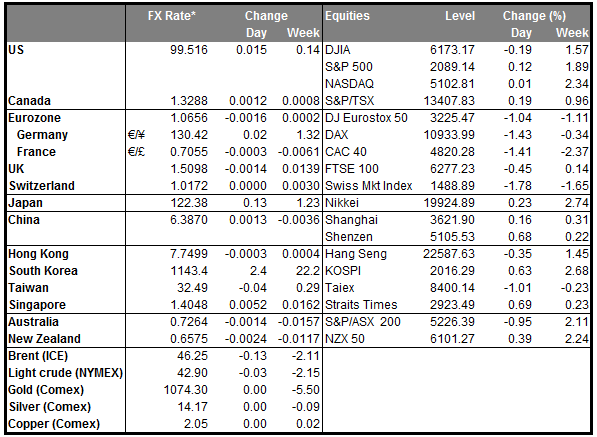
• Fed stays on hold, ‘monitoring global economy’ The Fed remained on hold yesterday, and expressed some concerns about the global financial turbulence. Officials took note of the recent global volatility by stating that they are closely monitoring global economic developments and they are assessing their implications for the labor market and inflation. The hints of concern among the FOMC members left market participants in doubt as to whether the Bank will take further action in March, pushing down the implied probability of such an event to 23% from 28%. Overall, while the statement reflected the cautious tone investors expected by acknowledging the increased international risks, the FOMC did not rule out a hike at the March meeting. Any improvement in the US data going into the next meeting could bring forward expectations for the Fed to pull the trigger, especially as officials will have updated projections and forecasts to work with.
• RBNZ also holds its fire but signals further easing The Reserve Bank of New Zealand also kept interest rates unchanged yesterday, but signaled that further easing may be required over the year to ensure inflation moves towards its target range. The Bank pushed back the date by which it expects inflation to hit its target, quoting a softening global economy, falling dairy prices and lower fuel prices as the main contributors of this delay. The RBNZ also talked-down the kiwi, stating that further depreciation in the currency is appropriate. If incoming data continue to show weakness, or if dairy and fuel prices continue falling, we could see expectations for a March rate cut to rise even more. The market currently assigns a probability higher than 50% of such action at the next meeting. This could keep NZD under pressure in coming weeks, which would also be in line with the Bank’s call for a weaker currency.
• Today’s highlights: During the European day, Sweden’s official unemployment rate for December is expected to have increased. This would be in line with an increase in the PES unemployment rate for the same month. The country’s retail sales for December are expected to have fallen, a turnaround from the previous month. Since both the indicators are released at the same time and are forecast to show a deterioration, we could see SEK weakening somewhat following these releases.
• In the UK, the preliminary estimate of Q4 GDP is expected to show that the growth rate has increased to +0.5% qoq from +0.4% qoq the previous quarter. However, there are doubts over the performance of the British economy as manufacturing and construction PMIs have softened throughout the quarter, while retail sales were mixed. Industrial and construction outputs have also been soft, with November’s reports revealing declines. A possible disappointment in the figure could push further back expectations for a rate hike from the BoE and could bring the pound under renewed selling pressure. Something like that would also confirm the recent comments by BoE Governor Carney that now it’s not the time to raise rates. Having all these in mind and given the uncertainty surrounding the “Brexit” referendum, we believe that the Bank could be reluctant to hike until there is greater clarity on Britain’s position within Europe.
• From Eurozone, the German flash CPI for January is forecast to have accelerated to +0.4% yoy, from +0.2% yoy in December. As usual, we will look at the larger regions for a guidance on where the headline figure may come in and thereby as an indication for the near-term direction of EUR. A rise in the inflation rate of Eurozone’s growth engine could indicate a rise in the bloc’s CPI rate due to be released on Friday and may support EUR, at least temporarily. Eurozone’s final consumer confidence for January is also coming out. Expectations are for the figure to show that the improvement in the preliminary print was short-lived, and instead confidence declined from the previous month.
• From the US, we get durable goods orders for December. Both the headline and core figures are forecast to have fallen after stagnating the previous month, mainly by shrinking demand for drilling equipment from energy producers as well as a stronger dollar, which makes exports less competitive. Moreover, the ISM manufacturing index for the same month slipped to its lowest level since 2009, increasing the possibilities for durable goods orders to decline. This could cause the greenback to weaken, at least temporarily. Initial jobless claims for the week ended on the 22nd of January are forecast to have decreased from the previous week. This would drive the 4-week moving average down as well. We also get pending home sales for December, which are expected to have rebounded after falling in November.
• We only have one speaker on Thursday’s agenda: ECB Governing Council member Jens Weidmann.
The Market
EUR/USD gains modestly after the Fed meeting
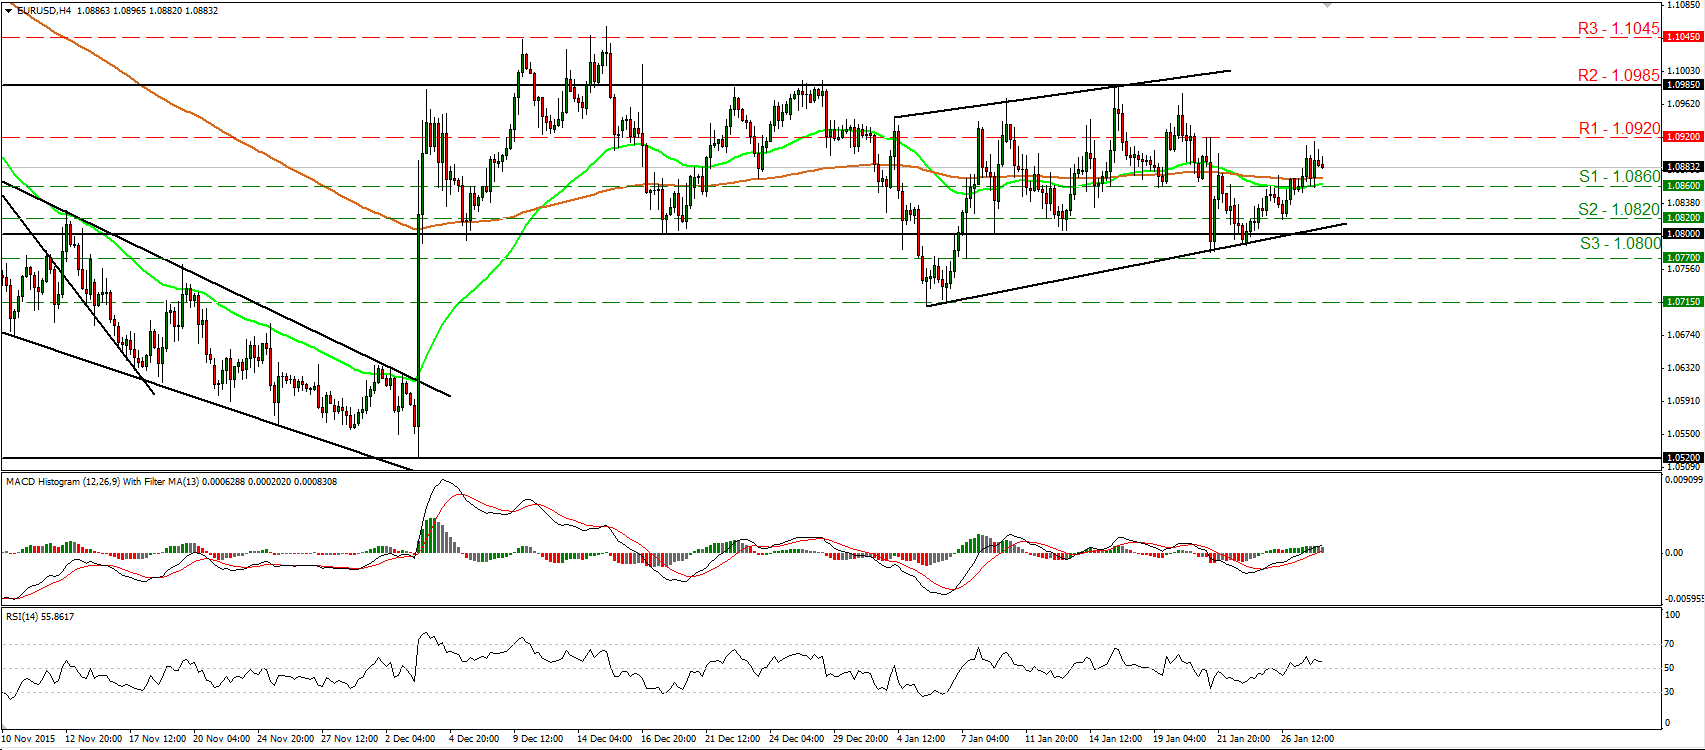
• EUR/USD traded higher yesterday ahead of the FOMC meeting. Following the decision, the pair remained elevated as the statement of the meeting showed that the Fed is in a “wait and see” mode, something that pushed lower the implied probability for a rate hike in March. For now, I see the possibility for the pair to continue higher for a while. A decisive move above the 1.0920 (R1) resistance line is possible to set the stage for more bullish extensions, perhaps towards the key obstacle of 1.0985 (R2). However, although there is the likelihood for further short-term advances, as long as it is trading between the 1.0800 (S3) key support area and the resistance zone of 1.0985(R2), I would still consider the near-term trend to be to the sideways. Our short-term oscillators still indicate upside momentum and support that EUR/USD could continue a bit higher. The RSI, although it points sideways, it stays above its 50 line, while the MACD stands above both its zero and trigger lines, pointing somewhat up. In the bigger picture, I will hold the view that as long as the pair is trading above the support obstacle of 1.0800 (S3), the longer-term picture stays flat as well.
• Support: 1.0860 (S1), 1.0820 (S2), 1.0800 (S3)
• Resistance: 1.0920 (R1), 1.0985 (R2), 1.1045 (R3)
GBP/USD slides after hitting once again the 1.4350 barrier
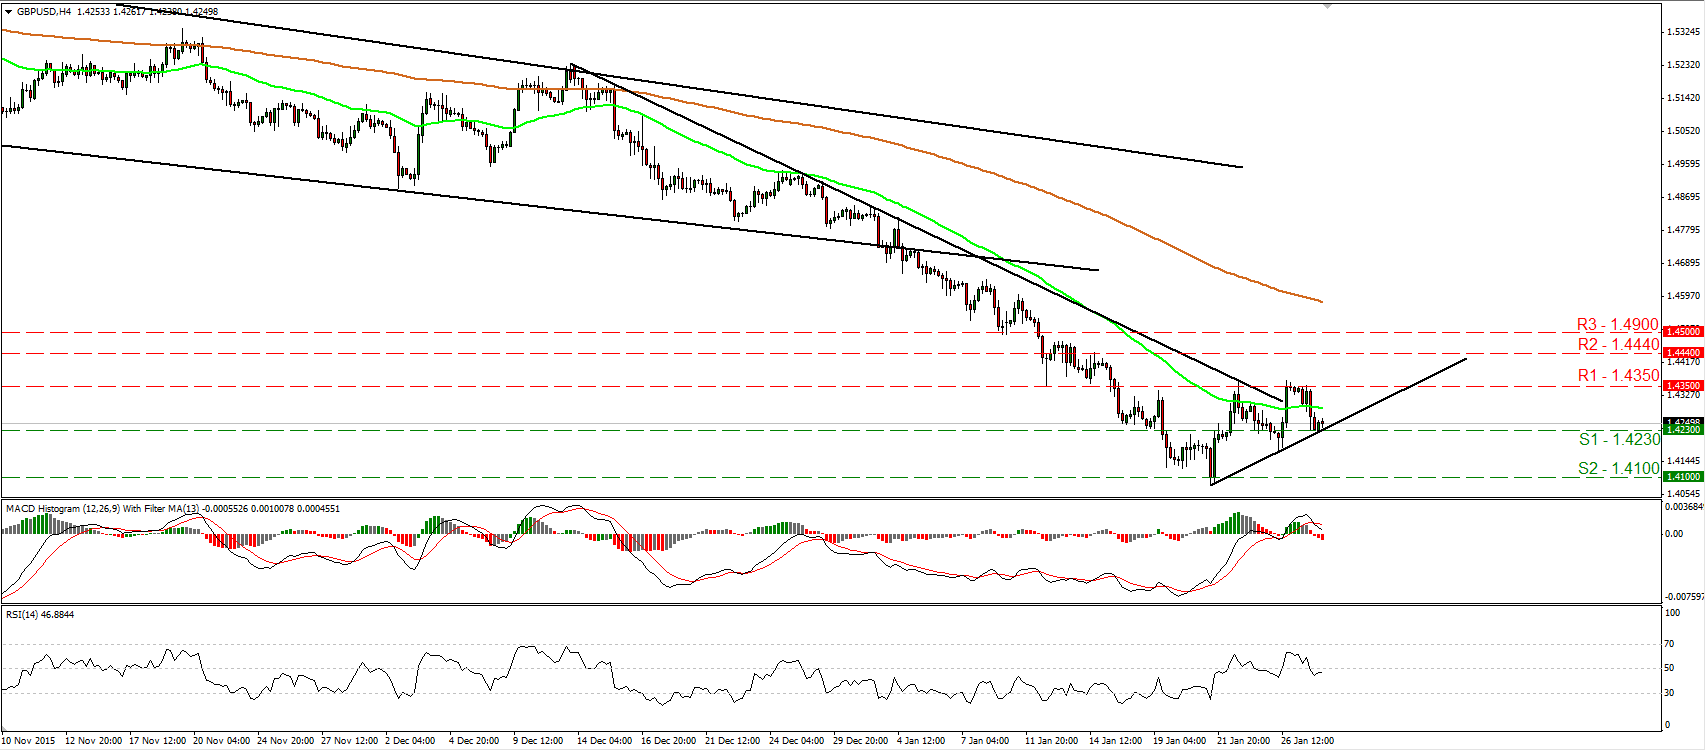
• GBP/USD slid yesterday after it hit once again resistance near the 1.4350 (R1) obstacle. Nevertheless the decline was stopped by the short-term upside support line taken from the low of the 21st of January, at 1.4230 (S1). As long as cable is trading above that line, the short-term outlook remains cautiously positive. But taking into account the inability of the bulls to overcome the 1.4350 (R1) hurdle, I would prefer to take the sidelines at the moment. I would like to see a clear move above 1.4350 (R1) before getting more confident on the upside. Something like that is likely to open the way for our next resistance of 1.4440 (R2). On the other hand, a dip below 1.4230 (S1) could shift the bias back to the downside and aim for the 1.4100 (S2) support area. In the bigger picture, the price structure remains lower peaks and lower troughs below the 80-day exponential moving average, which is pointing down. Thus, I still see a negative longer-term picture.
• Support: 1.4230 (S1), 1.4100 (S2), 1.4000 (S3)
• Resistance: 1.4350 (R1), 1.4440 (R2), 1.4900 (R3)
EUR/JPY surges above 128.50
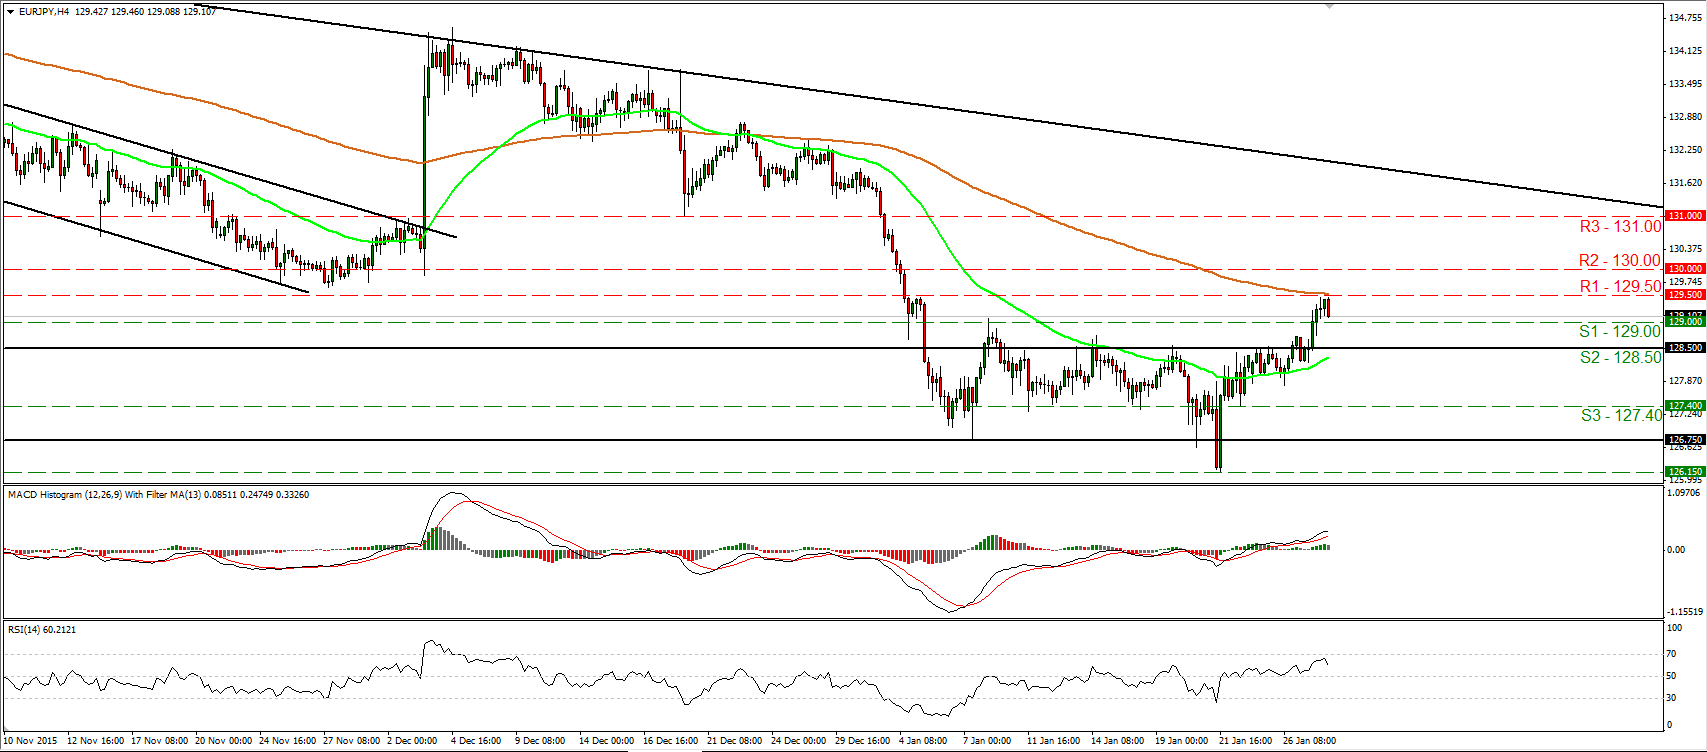
• EUR/JPY traded higher on Wednesday, breaking above the key resistance (now turned into support) territory of 128.50 (S2). Nevertheless, the advance was stopped at the 129.50 (R1) line and then the pair retreated somewhat. Although the break above 128.50 (S2) looks to have turned the short-term picture positive, for now, I see the possibility for the current pullback to continue. A clear move below 129.00 (S1) would confirm the case and perhaps challenge the 128.50 (S2) line as a support this time. Our short-term momentum studies support the notion as well. The RSI turned down after it hit resistance near its 70 line, while the MACD, although positive, has topped and could fall below its trigger line soon. Switching to the daily chart, I see that on the 4th of December, the rate started tumbling after it hit resistance near the downtrend line taken from the peak of the 21st of August. Therefore, I would consider the longer-term picture to be negative and I would treat any possible further near-term advances as a corrective phase.
• Support: 129.00 (S1), 128.50 (S2), 127.40 (S3)
• Resistance: 129.50 (R1), 130.00 (R2), 131.00 (R3)
Gold fails to hold above 1122
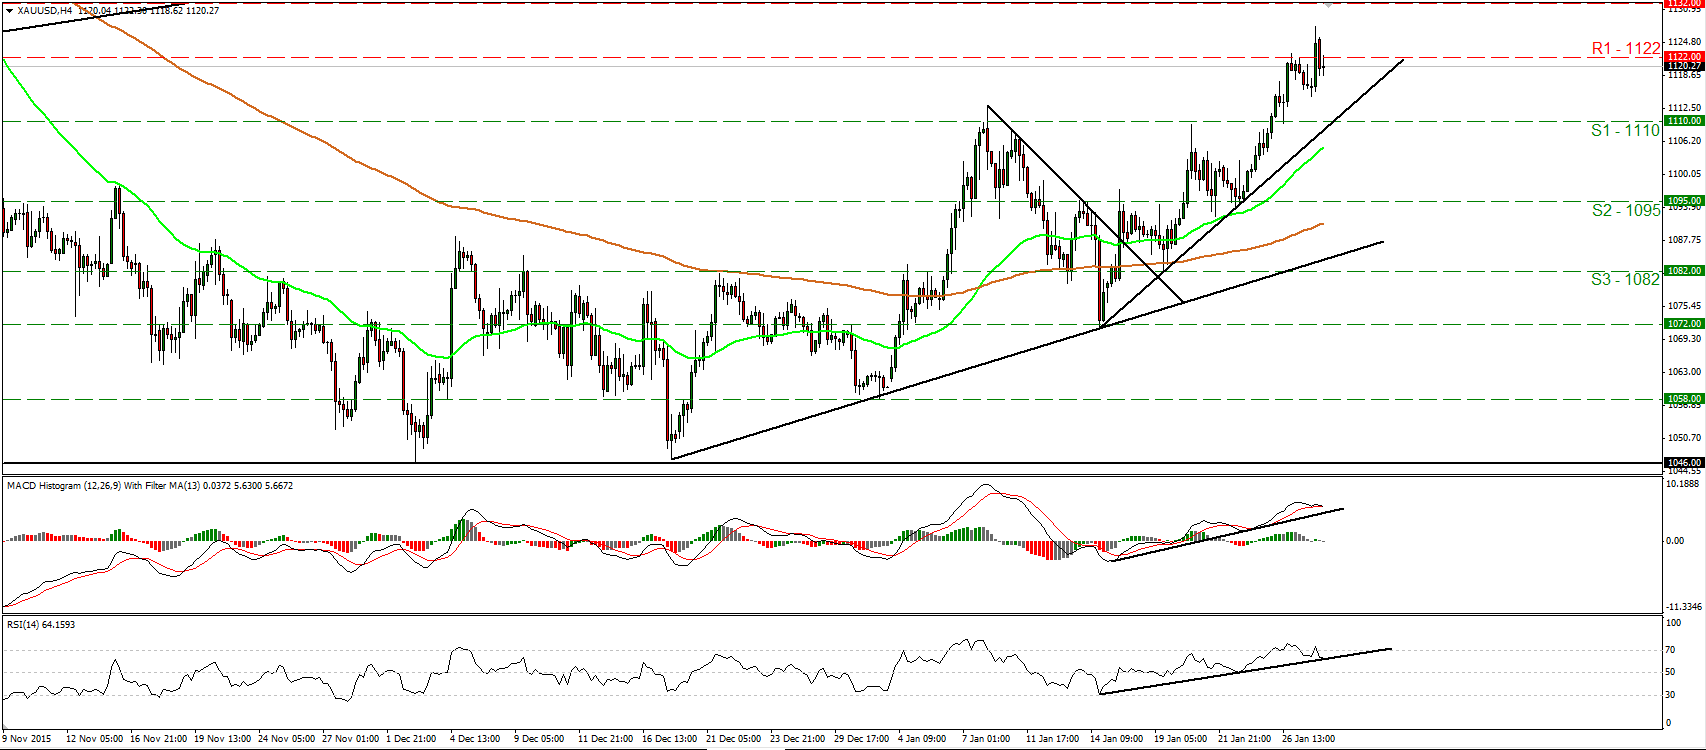
• Gold traded higher after the FOMC decision and emerged above the resistance zone of 1122 (R1). However, the advance was short-lived and the yellow metal retreated to trade back below 1122 (R1). The price structure remains higher peaks and higher troughs above the short-term uptrend line taken from the 14th of January and as a result, I would consider the near-term outlook to stay positive. I believe that another attempt above 1122 (R1) is likely to carry more bullish extensions and perhaps target our next hurdle of 1132 (R2). Taking a look at our oscillators though, I see the likelihood that the current setback may continue for a while before the bulls decide to pull the trigger again. The RSI exited its above-70 zone and now looks ready to fall below its upside support line, while the MACD, although positive, has topped and looks ready to fall below its trigger line. As for the broader trend, the break above 1110 (S1) has confirmed a forthcoming higher high on the daily chart, something that keeps the medium-term outlook somewhat positive.
• Support: 1110 (S1), 1095 (S2), 1082 (S3)
• Resistance: 1122 (R1), 1132 (R2), 1140 (R3)
DAX futures slide after hitting resistance at 9935
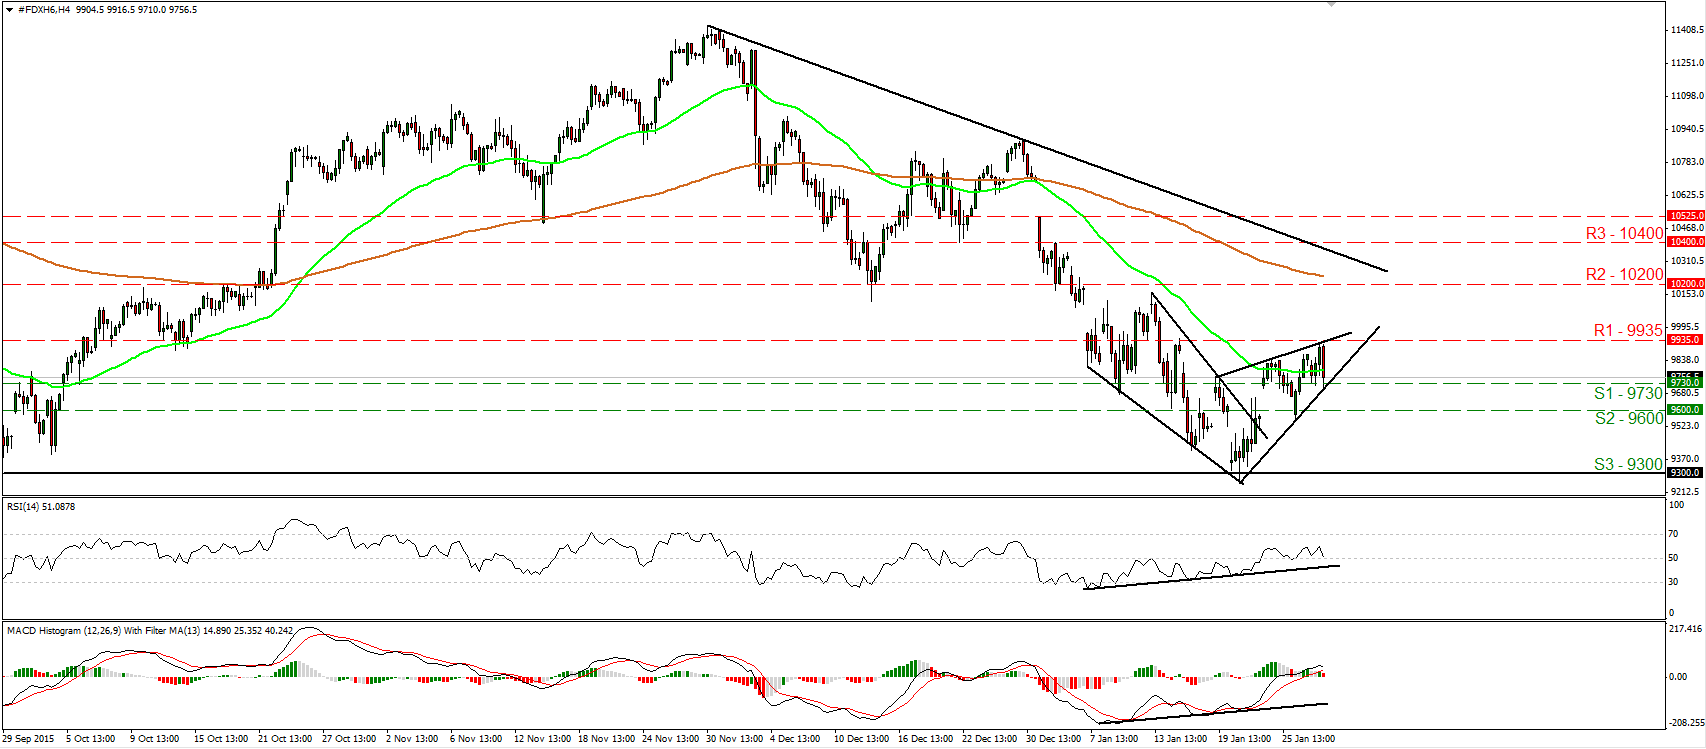
• DAX futures traded lower on Wednesday after it hit resistance at the 9935 (R1) obstacle. Given that the index looks to be trading in a rising wedge now, I see the possibility for the retreat to continue. A decisive move below 9730 (S1) is possible to initially aim for the next support line of 9600 (S2). Further declines are also supported by our short-term oscillators. The RSI has turned down again and appears ready to move below its trigger line, while the MACD shows signs of topping slightly above zero and could turn negative soon. On the daily chart, I see that since the 1st of December the index has been printing lower peaks and lower troughs, something that keeps the longer-term picture negative.
• Support: 9730 (S1), 9600 (S2), 9300 (S3)
• Resistance: 9935 (R1), 10200 (R2), 10400 (R3)


