Family Dollar Stores, Inc. reports preliminary financial results for the quarter ended August 31, 2014.
Family Dollar Stores Inc (NYSE:FDO) just reported its preliminary financial results based on which we provide a unique corporate earnings release based analysis of its performance. Our analysis focuses on the company’s performance for the same quarterly period on a year-on-year basis (unless stated otherwise).
FDO-US is one of the first companies amongst its peer group to announce earnings for this period.
Highlights
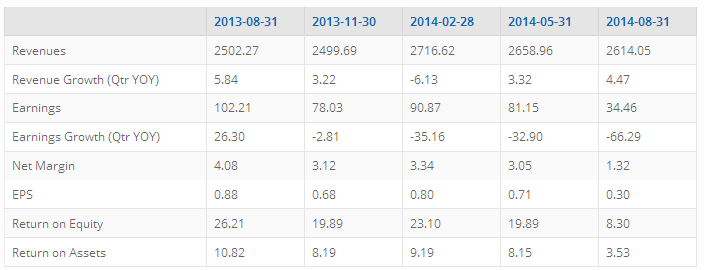
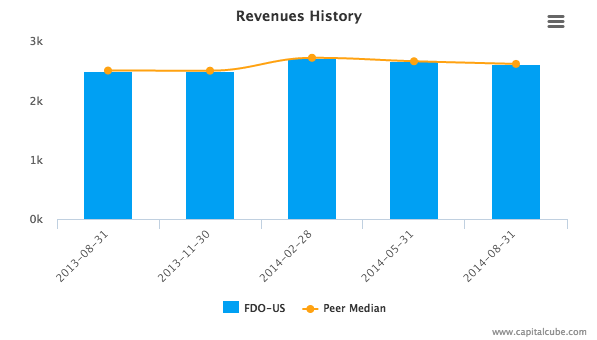
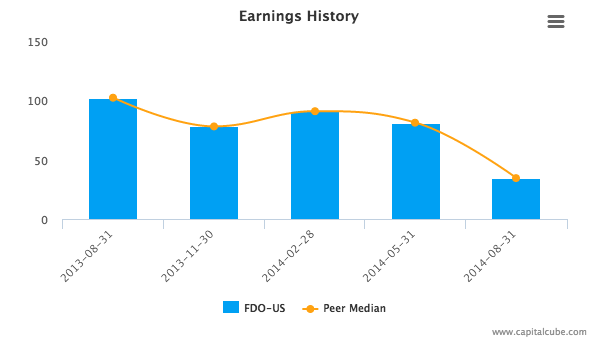
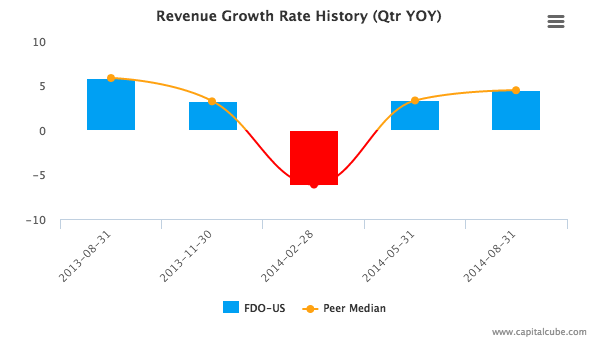
Summary numbers: Revenues of USD 2,614.05 million, Net Earnings of USD 34.46 million and EPS of USD 0.30. Performance focus more on top-line than bottom-line: same period year-on-year revenue change of 4.47% vs. change in earnings of -66.29%.
EBITDA margins now 4.40% from 8.70%
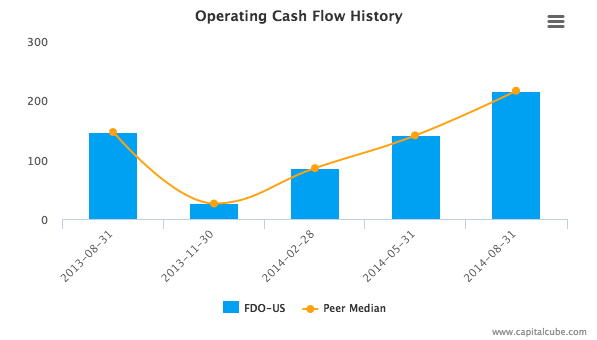
Ability to strengthen the balance sheet? Year-on-year change in Operating Cash Flow of 47.43% better than change in earnings.
Earnings decline from operating margin decreases as well as from unusual items
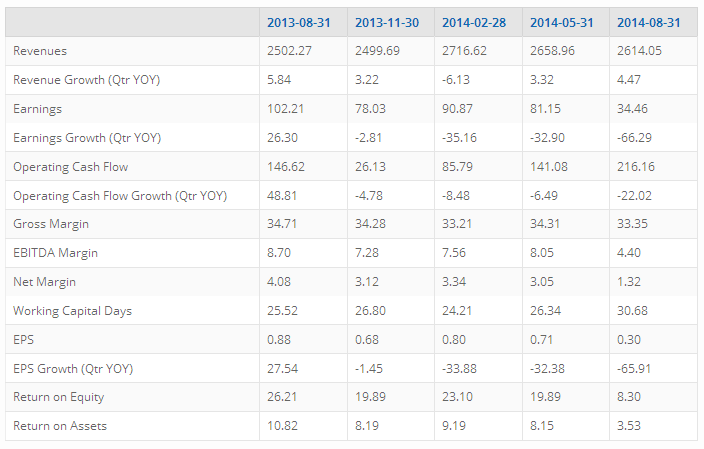
The table below shows the preliminary results and recent trends for key metrics such as revenues and net income (See complete table at the end of this report):
Revenue Growth Versus Earnings Growth
Companies sometimes focus on growing their top-line (Sales or Revenues) more than their bottom-line i.e. Earnings or Net Income. Investors should look at revenue growth to understand a company’s ability to grow its market share, and earnings growth to look at the company’s ability to generate returns. Comparing revenue growth to earnings growth helps understand a couple of items: (1) A company’s focus on gaining market share vs. generating profits and (2) How additive or dilutive the revenue performance has been to earnings.
FDO-US’s year-on-year change in top line compared to the same period last year of 4.47% is better than its change in earnings which was -66.29%. The company’s performance this period suggests a focus on the top-line at the expense of bottom-line earnings. It remains to be seen how the rest of the peer group results turns out and if FDO-US’s performance suggests any major shift in the composition of market share in this sector. Also, for comparison purposes, revenues changed by -1.69% and earnings by -57.53% compared to the immediate last quarter.
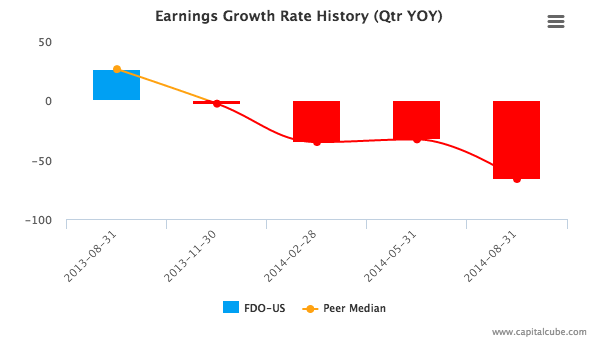
Earnings Growth Trend
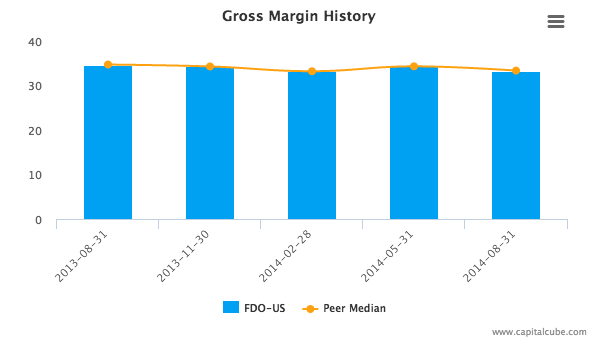
The company’s year-on-year decline in earnings has been influenced by the following factors: (1) Decline in gross margins from 34.71% to 33.35% and (2) issues with cost controls. As a result, operating margins (EBITDA margins) went from 8.70% to 4.40% in this period. For comparison, gross margins were 34.31% and EBITDA margins 8.05% in the immediate last quarter.
Gross Margin
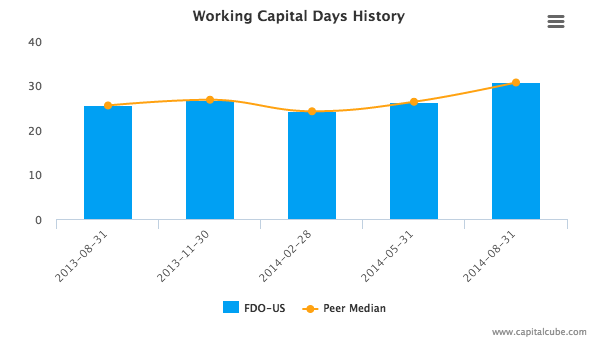
TrendCompanies sometimes tradeoff for improvements in revenues and margins by extending friendlier terms to customers and vendors. One quick way to check against such activity is to compare the changes in gross margins with any changes in working capital. If the gross margins improved without a worsening of working capital, it is quite possible that the company’s performance is a result of truly delivering in the marketplace and not simply a prop up using the balance sheet.
The company’s decline in gross margins is compounded by issues on the balance sheet side – there has been deterioration in working capital levels. The company’s working capital days have gone up to 30.68 from 25.52 for the same period last year.
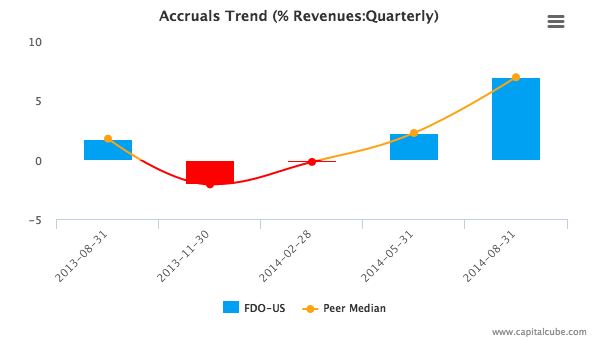
Operating Cash Flow Growth Versus Earnings Growth
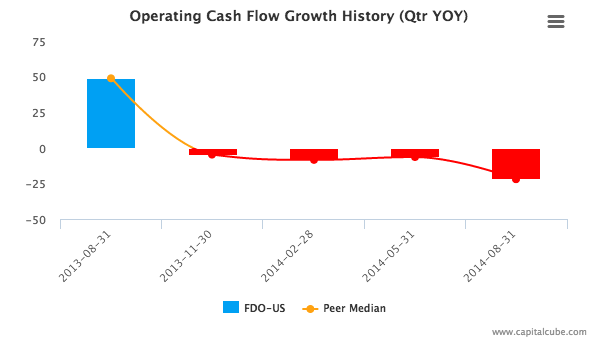
Companies often post earnings numbers that are influenced by non-cash activities. One way to gauge the quality of the declared earnings number is to judge the deviation in the growth in earnings from the growth in operating cash flows. In general, an earnings growth rate that is higher compared to the operating cash flow growth implies a higher proportion of non-operating and even one-time activities – such activities are typically not sustainable over long periods.
FDO-US’s year-on-year change in Operating Cash Flow of 47.43% is better than its change in earnings suggesting some ability to strengthen the balance sheet.
Unusual Items
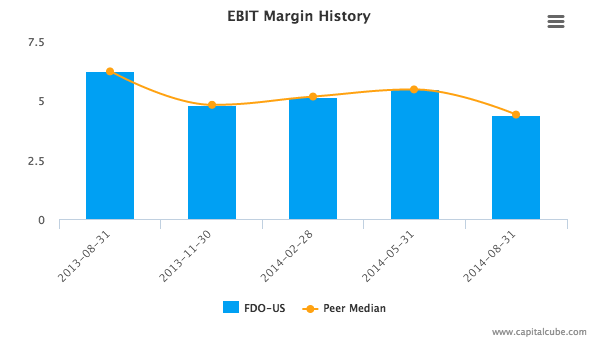
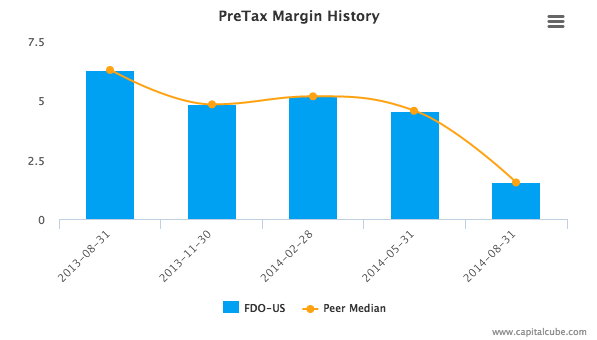
The company’s decline in earnings has been influenced by the following factors: (1) Decline in EBIT margins from 6.22% to 4.40% and (2) unusual items that decreased pretax margins from 6.28% to 1.54%
EPS Growth Compared To Earnings Growth
FDO-US’s year-on-year change in Earnings per Share (EPS) of -65.91% is better than its change in earnings of -66.29%.
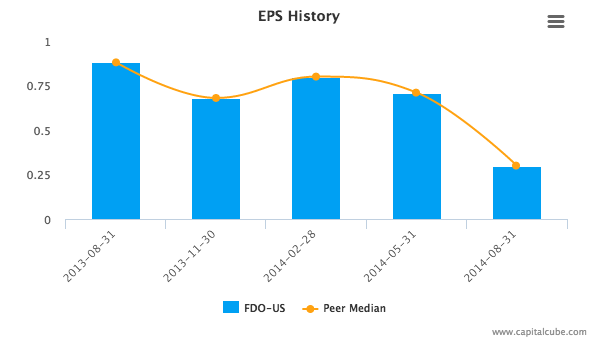
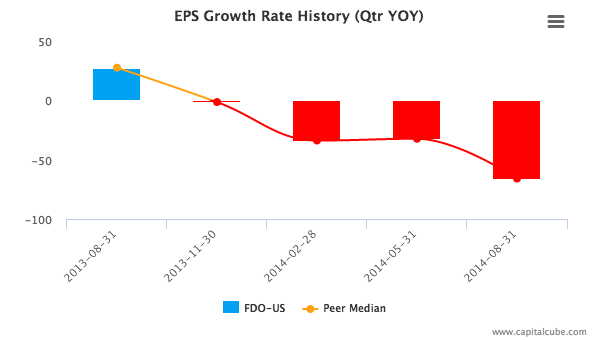
Supporting Data
The table below shows the preliminary results along with the recent trend for revenues, net income and other relevant metrics:
Company Profile
Family Dollar Stores, Inc. operates general merchandise retail discount stores. Its products are categorized under consumables, home products, apparel and accessories, and seasonal and electronic products. The company’s consumables category products include household chemicals, paper products, food, health and beauty aids, hardware and automotive supplies, pet food and supplies. Its home products include domestics, which include blankets, sheets and towels, housewares, giftware, home decor. The company’s apparel and accessories category products include men’s, women’s, boys’ and girls, and infants’ clothing shoes and fashion accessories. Its seasonal and electronics products category include toys, stationery and school supplies, seasonal goods, personal electronics, which include pre-paid cellular phones and services. It has offices in China, Hong Kong, Luxembourg and the United States of America. Family Dollar Stores was founded by Leon Levine in November 1959 and is headquartered in Matthews, NC.
Disclaimer: The information presented in this report has been obtained from sources deemed to be reliable, but AnalytixInsight does not make any representation about the accuracy, completeness, or timeliness of this information. This report was produced by AnalytixInsight for informational purposes only and nothing contained herein should be construed as an offer to buy or sell or as a solicitation of an offer to buy or sell any security or derivative instrument. This report is current only as of the date that it was published and the opinions, estimates, ratings and other information may change without notice or publication. Past performance is no guarantee of future results. Prior to making an investment or other financial decision, please consult with your financial, legal and tax advisors. AnalytixInsight shall not be liable for any party’s use of this report. AnalytixInsight is not a broker-dealer and does not buy, sell, maintain a position, or make a market in any security referred to herein. One of the principal tenets for us at AnalytixInsight is that the best person to handle your finances is you. By your use of our services or by reading any our reports, you’re agreeing that you bear responsibility for your own investment research and investment decisions. You also agree that AnalytixInsight, its directors, its employees, and its agents will not be liable for any investment decision made or action taken by you and others based on news, information, opinion, or any other material generated by us and/or published through our services. For a complete copy of our disclaimer, please visit our website www.analytixinsight.com.
