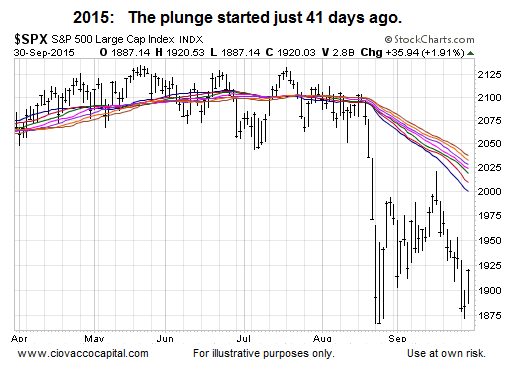
Those close to the markets know stocks had a very difficult time between the close on August 19 and August 25. In fact, between those dates, the maximum drop in the broad NYSE Composite Stock Index was 11.02%. Given the severity of the plunge, history says we should be open to more volatility, even under bullish scenarios.
How Long Could It Take To Settle Down?
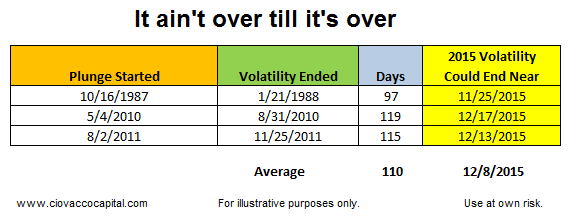
The charts below show the volatility following three of the most notable waterfall declines lasted for an average of 110 calendar days. The 2015 waterfall plunge began on August 20; 110 days from August 20, 2015 is December 8, 2015. Therefore, it may be premature to think we are close to “smooth sailing into year end”.
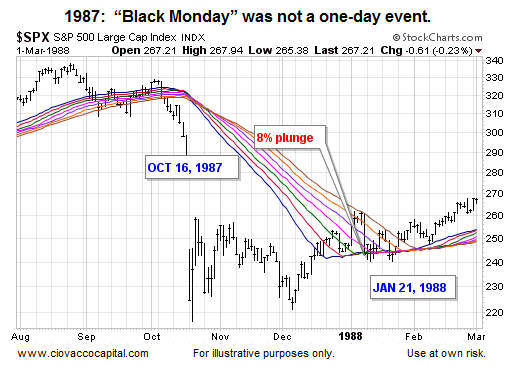
1987: 97 Days
Stocks had a successful retest of the October 1987 low in early December 1987, but that was not the end of the wild ride. The S&P 500 plunged 8% in early 1988, before calming down and establishing a profitable trend.
Flash Crash Myth
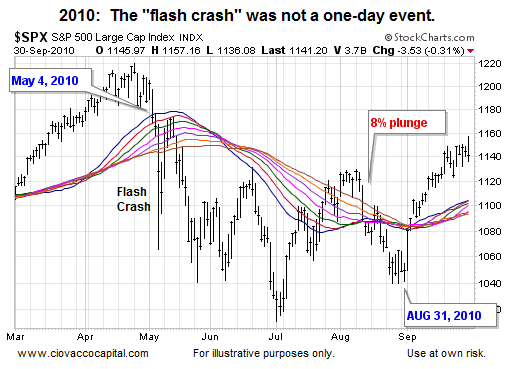
The 2010 “flash crash” is often referred to as a one-day black swan event. That is not really how it played out in the real world. Did those who bought the flash crash intraday low have nothing but smooth sailing in the subsequent days and weeks? Hardly, stocks did not calm down for 119 calendar days after the flash crash.
2011: 115 Days
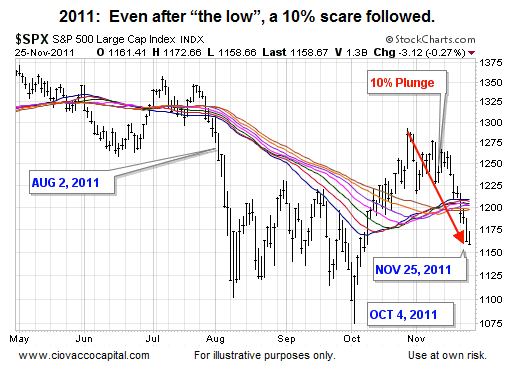
Was it smooth sailing after the successful retest of the lows in October 2011? Hardly, even after the October 4 intraday reversal the S&P 500 experienced one more “here we go again” plunge of 10%. The wild swings finally started to calm down around November 25, 2011. Notice when the volatility was close to ending: (a) price had recently moved back above the moving averages (not so in 2015), (b) price was near the moving averages (not so in 2015) and the moving averages were close together and flat (not so in 2015).
What Else Can We Learn From The Charts Above?
Also note, in the historical charts above, volatility tended to calm down when price was close to the moving averages (or above the moving averages) and the slopes of the moving averages were closer to being flat, rather than having steep negative slopes (as we do now).
Historical Overlays: A Form Of Forecasting
Could 2015 play out exactly like 2011? Anything is possible, but years of experience says multiple-month market analogies rarely, if ever, carry through to the predicted conclusion. Under our approach, with price and the hard data as our guides, we do not need to cloud the waters with historical overlays and predictions. If 2015 plays out exactly like 2011, then price and the data will not miss it. If 2015 plays out in an entirely different manner vs. 2011, then price and the hard data will not miss it.
Does This Change Our Approach?
The answer to the question above is “not at all”. As noted during the big rally in stocks on Wednesday via several tweets:
