Less than three months ago, analysts everywhere argued a case for economic acceleration. It was almost as if financial authorities big and small had held a convention at LEGOLAND in California to declare that, “Everything Is Awesome.”
Everything is not awesome. Jobless claims hit 10-month highs, factory orders have dropped for six consecutive months, consumer spending has been waning, exports have been declining and demand for raw goods as measured by shipping rates have been notching historical lows.
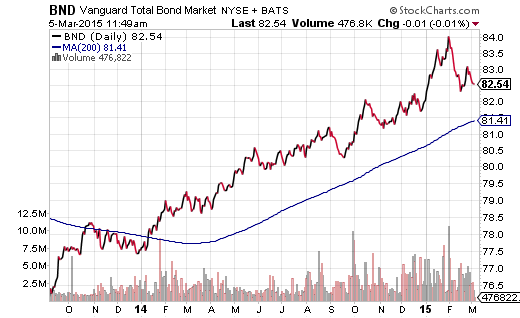
In fact, the only thing that can genuinely be described as wonderful are investor account values. The Vanguard Total Stock Market ETF (ARCA:VTI) remains within one percentage point of a brand new record and the Vanguard Total Bond Market ETF (NYSE:BND) has been in a long-term uptrend since the start of 2014. Any traditional asset allocation mix has bolstered the wealth and well-being for those with 401ks, IRAs and brokerage accounts.

Nevertheless, there is a disconnection between investor expectations and economic realities. If one expects an economy to accelerate, one may conclude that corporations will generate more revenue and more profits, thereby justifying increasing prices for stock shares. If one expects economic deceleration – if sales and profits are not even expected to grow on a year-over-year basis – one might anticipate equity prices to remain range-bound.
However, stocks already command sky-high premiums. Moreover, the Federal Reserve appears determined to normalize interest rates which might cause the economy to grind to a halt. It follows that equities may fumble on the way to flatness, eventually pulling back 10%-15% at some point in 2015. Rare is the historical circumstance when decelerating economic activity and overvaluation combined did not cause a stock market correction. Mix in a policy misstep by the Federal Reserve or a crisis abroad, and the probability of a bearish outcome increases.
Six years of quantitative easing (i.e., QE1, QE2, Operation Twist, QE3) and zero percent rate policy guided the U.S. economy toward an average growth rate of 2.2%. That is well below the 3% longer-term average. What is particularly disturbing about this truth is that – since QE3 ended on 10/29/14, the overall economy has steadily weakened. What happened to the notion that the economy is “self-sustaining?”
Most folks expect the Fed to push off rate hikes into the 4th quarter, giving them reason to keep buying stocks on every modest dip from all-time peaks. Indeed, even if the economy became fragile enough to stoke recessionary fears, most seem to believe that the Fed would backtrack to the point of providing additional rounds of QE stimulus. The message? Don’t stop buying and don’t stop believing in the Fed.
On the other hand, what if central bankers stateside weigh the benefits of permitting a smaller recession today to avoid a massive speculative bubble from exploding down the road? What if letting some air out of the severely overvalued equity and debt markets now makes more sense to committee members than riding to the rescue at the first sign of fragility? After all, it is well-documented that neither Greenspan nor Bernanke – chairmen of the Fed prior to Janet Yellen’s arrival – were able to respond quickly enough to prevent the monstrous dot-com disaster (2000-2002) or the systemic financial collapse (2008-2009).
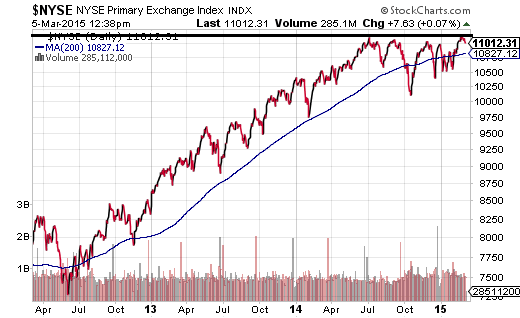
In spite of the NASDAQ 5000 headlines, other signals have been flashing yellow. Margin debt on the NYSE, a sign that investors are willing to borrow to leverage upside gains, has been declining steadily. Margin debt currently sits below a 12-month average. Similarly, the NYSE Composite has not been able to break above resistance levels set back in July.

So how might one handle the high likelihood of a stock market pullback? Apply insurance principles to the investing process. A 65%-35% growth-income investor might decide that a better tactical asset allocation for the current environment would be 50%-30%-20% such that the 20% cash buffer acts as a intermediate-term insurance policy against a sharp downturn. The cash buffer might also be employed in a corrective phase; that is, one can incrementally purchase equity and debt during the pullback, averaging one’s way back to the 65%-35% target.
Others may wish to employ a multi-asset approach to stock hedging. Specifically, there are certain assets that have historically succeeded at a time when stocks are being eviscerated. Currencies like the Swiss franc, US dollar and the Japanese yen – each for different reasons – tend to appreciate in stock market bears.
The sovereign debt of Germany and Japan have acted as safer havens. Precious metals like gold have often seen strong demand. Finally, a wide variety of U.S. debt – minus, zero coupon, long-term treasuries, inflation-protected – were winners in the 2008 catastrophe and the 2011 eurozone crisis.
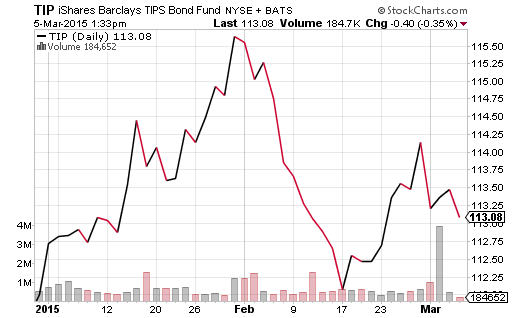
For those who wish to beat the bear without shorting or leverage, combining a wide variety of bear-bashing assets may be preferable than T-bills or cash alone. One can look to track an established index like the FTSE Custom Multi-Asset Stock Hedge Index or purchase individual ETF components with potential. For instance, inflation expectations may be non-existent, yet the iShares TIPS Bond Fund (ARCA:TIP) has still provided low-risk value to its owners with a 1.3% total return in the first few months of 2015.

Disclaimer: Gary Gordon, MS, CFP is the president of Pacific Park Financial, Inc., a Registered Investment Adviser with the SEC. Gary Gordon, Pacific Park Financial, Inc, and/or its clients may hold positions in the ETFs, mutual funds, and/or any investment asset mentioned above. The commentary does not constitute individualized investment advice. The opinions offered herein are not personalized recommendations to buy, sell or hold securities. At times, issuers of exchange-traded products compensate Pacific Park Financial, Inc. or its subsidiaries for advertising at the ETF Expert web site. ETF Expert content is created independently of any advertising relationships.
