
Eversource Energy’s (NYSE:ES) second-quarter 2016 operating earnings of 77 cents per share were on par with the Zacks Consensus Estimate but lagged the year-ago quarter by a penny.
Total Revenues
Eversource Energy’s second-quarter revenues of $1,767 million lagged the Zacks Consensus Estimate of $1,851 million by 4.5% and declined 2.7% from the year-ago level of $1,817.1 million.
Highlights of the Release
Operating expenses decreased nearly 4.4% year over year to $1,343.7 million, primarily due to lower purchased power, and fuel and transmission expenses.
Operating income was up by 2.7% to $423.4 million from $412.1 million a year ago.
In the reported quarter, interest expense was $100.5 million, up 8.9% from the year-ago level.
EVERSOURCE EGY Price, Consensus and EPS Surprise
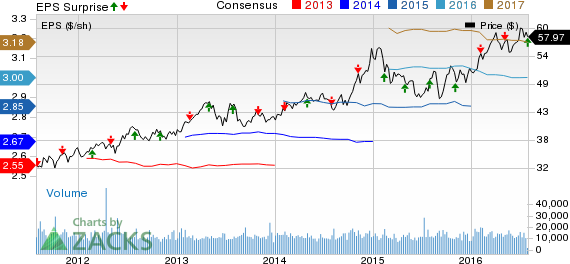
EVERSOURCE EGY Price, Consensus and EPS Surprise | EVERSOURCE EGY Quote
Segmental Performance
Electric Distribution and Generation: Segment earnings tanked 15% to $102.8 million primarily due to lower retail sales, as well as higher depreciation and property tax expense due to an increased level of investment in Eversource Energy’s electricity delivery systems.
Electric Transmission: Segment earnings surged 15.1% to $92.5 million on the back of a higher level of investment in transmission facilities.
Natural Gas Distribution: The segment reported earnings of $8.0 million, down 50.9% from the year-ago figure of $5.3 million.
Parent & Other Companies: The segment earned $0.3 million compared with $0.9 million In the year-ago period.
Financial Update
Cash and cash equivalents were $38.7 million as of Jun 30, 2016, up from $23.9 million as of Dec 31, 2015.
Long-term debt was $9,435.9 million as of Jun 30, 2016, up from $8,805.6 million as of Dec 31, 2015.
Cash flow from operating activities during the first six months of 2016 was $978.4 million, up from $865.3 million in the year-ago comparable period.
Other Peer Releases
WEC Energy Group (NYSE:WEC) reported second-quarter 2016 adjusted earnings of 57 cents per share, 3.6% above the Zacks Consensus Estimate of 55 cents.
American Electric Power Co., Inc. (NYSE:AEP) reported second-quarter 2016 operating earnings of 95 cents per share, beating the Zacks Consensus Estimate of 90 cents by 5.6%.
DTE Energy Company (NYSE:DTE) reported second-quarter 2016 operating earnings per share of 98 cents, beating the Zacks Consensus Estimate of 90 cents by 8.9%.
Zacks Rank
Eversource Energy carries a Zacks Rank #3 (Hold).
Want the latest recommendations from Zacks Investment Research? Today, you can download 7 Best Stocks for the Next 30 Days.Click to get this free report >>
AMER ELEC PWR (AEP): Free Stock Analysis Report
WEC ENERGY GRP (WEC): Free Stock Analysis Report
DTE ENERGY CO (DTE): Free Stock Analysis Report
EVERSOURCE EGY (ES): Free Stock Analysis Report
Original post
Zacks Investment Research