
Covered call writing and put-selling calculations must be accurate and preferably understood by option-sellers. I created the Ellman Calculators to facilitate the authentic computations we depend on. In this article, I will review a successful trade executed by one of our members, David L, who used UTHR from our Premium Running list as the underlying security.
Initial trade for the March contract
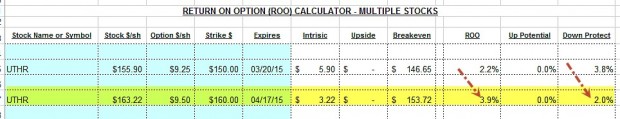
- Buy UTHR @ $155.90
- Sell March $150 in-the-money call for $9.25
- Intrinsic value = $5.90
- Time value (Dave’s initial profit) = $3.35/share
- ROO = $3.35/$150 = 2.2%
- Downside protection of ROO = 3.8%

Initial returns for UTHR
This represented an excellent conservative position to take on one of our outstanding performers.
Trade status one week prior to expiration
- Share price = $163.22
- Cost to close = $15.50
- Considering rolling out and up
- April $160 call generates $9.50
Using the “What Now” tab of the Ellman Calculator to calculate rolling out and up 1 week prior to expiration

Rolling out and up with UTHR
The computations show a 5-week return of 2.57% with 2% downside protection of that profit (not breakeven).
Return if we opened the position today
David astutely pointed out that if the position were entered 1-week prior to expiration that the initial return would be 3.9% as shown in the screenshot below:
United Therapeutics Corporation (NASDAQ:UTHR) calculations 1-week prior to expiration
What is our real return, 2.57% or 3.9%?
It’s 2.57%. To own the shares at $163.22 (current market value) we would have to buy back the option at $15.50. That would raise the real-life value of the shares from $150 (the option obligation) to $163.22 or + $13.22, leaving a net debit of $2.28 or 1.5%. This must be factored into our real-life returns. Rolling the option will also result in one less commission than closing the entire original position and re-opening at $163.22.
When should the option be rolled?
Next week. Dave had huge downside protection of his initial option profit and was fairly safe to max the returns from his original trade. Time value erosion of the option premium is logarithmic in nature, not linear, so the near term option time value will deteriorate faster than the next month option. It will be advantageous to us to wait closer to expiration to begin the rolling process.
Congratulations to David on an outstanding trade.
Market tone
We had a mixed week of economic data along with global concerns, both economic and political, leading to a volatile and down week for our markets:
- According to the Commerce Department, the 3rd estimate of 4th quarter GDP remained at 2.2% on an annualized basis, below the 2.4% expected by analysts
- New orders for durable goods declined by 1.4% in February. Experts anticipated a 0.3% increase
- Sales of existing homes increased by 1.2% in February after reaching a 9-month low in January. However, sales were up 4.7% year-over-year
- The median price of existing homes rose by 7.5% year-over-year
- Sales of new homes had its 3rd month of impressive gains, increasing by 7.8% in February. Experts were expecting a decline
- New-home inventory declined from 5.1 to 4.7 months
- Year-over-year, sales of new homes rose by 24.8%
- The median price of new homes rose by 2.6% year-over-year
- The Consumer Price index (CPI) rose by 0.2% in February after falling the 3 previous months. Compared to February, 2014, the CPI was unchanged
- Initial jobless claims for the week ending March 21st came in at 282,000, below the 290,00 projected by experts
For the week, the S&P 500 fell by 2.2% for a year to date return of 0.6%, including dividends.
Summary
IBD: Uptrend under pressure
GMI: 2/6- Buy signal since market close of January 23, 2015
BCI: Cautiously bullish using an equal number of in-the-money and out-of-the-money strikes. I am inclined to be more conservative until we can view the market reaction to the first interest rate increase and market volatility levels off.