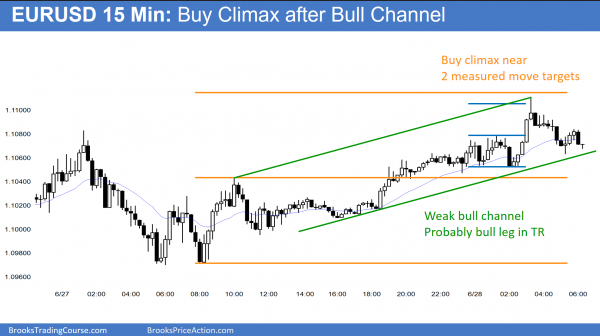
The overnight rally on the 15 minute chart lacked consecutive big bull trend bars until its climactic top. It was also in a broad bull channel. Therefore, this rally is probably a bull leg in a developing trading range.
Friday was a huge bear trend day on the EUR/USD daily chart, yet it closed far above its low. Most noteworthy is that it is still above the March 10 bottom of the huge bull reversal. That low is an important support level. As a result of the EUR/USD forex chart being in a yearlong trading range and close to support, it probably will test that low.
Yesterday’s high did not go above the May 30 or June 16 lows. As a result, there is a gap. If the gap stays open, it could be a measuring gap. The initial target is around the May 30 low. Because of Friday’s sell climax and the yearlong trading range, there is a 60% chance that the gap will close. Hence, the odds are that Friday will be an exhaustion gap. If the gap closes, a measured move down still may follow. Yet, that buying pressure would reduces the odds of a big bear trend.
Sell climax on EUR/USD daily forex chart
As a result of the possible climactic reversals, traders will look to buy trend resumption down in the EUR/USD forex chart. Bulls will buy a bear breakout of a bear flag. It is too early to know if there will be more buyers and sellers. Since the 2 day follow-through selling has been bad, there is confusion. Hence, the bulls and bears are more balanced than in a strong bear breakout.
If this is an exhaustive sell climax, the daily chart of the EUR/USD might enter a trading range for a month or more. Therefore, as more bull bars appear, traders will be more willing to buy below bars, betting that bear breakouts will fail. They will also sell above bars, betting that rallies will not go far either. This is trading range price action. There is at least a 50% chance that this will unfold over the next month. There is therefore less than a 50% chance that Friday’s big bear breakout will get strong follow-through selling over the next 2 weeks.
A sell climax does not mean a bull trend. It simply means that the market fell too far and too fast. It usually leads to a trading range. The probabilities then become about the same for the bulls and bears. Hence, the chart enters breakout mode.
European session
Yesterday was a doji inside day. Hence, the bears do not yet have their follow-through selling. The EUR/USD Forex market is up 60 pips and it tested above the May low. If today closes above its open, it will be the 2nd consecutive bull day. Hence, the follow-through selling will be bad. Many financial markets had sell climaxes late in bear trends. Consequently, the odds that these moves are exhaustive are 50% or more, like on the EUR/JPY daily chart.
The overnight rally on the 60 minute chart lacked consecutive big bull bars closing on their highs. Hence, it was probably a bull leg in a developing trading range. The bars and legs on the 5 minute chart have been big enough for 20 pips scalps. However, as they shrink, scalpers will switch to 10 pip scalps.
There was a buy climax on the 5 minute chart 3 hours ago. There was then a 50 pip selloff. This is a Big Up, Big Down candlestick pattern. Hence, a trading range is likely.
