EUR/USD
The Euro remains weak and ticked lower, after brief corrective attempt off 1.3117 was capped at 1.3144. The pair eyes immediate target at 1.31, however, yesterday’s Doji candle may signal further consolidation ahead of 1.31 support, as daily studies are overextended, but no reversal signal being generated yet. Yesterday’s corrective high at 1.3144 offers initial resistance, along with 1.3155 zone, previous lows and Fibonacci 38.2% of 1.3219/1.3113 down leg, where corrective rallies should find good resistance, before fresh push lower. Conversely, extension through pivotal 1.3200/19 barriers would signal stronger recovery and sideline immediate bears.
Res: 1.3144; 1.3155; 1.3194; 1.3220
Sup: 1.3113; 1.3103; 1.3050; 1.3020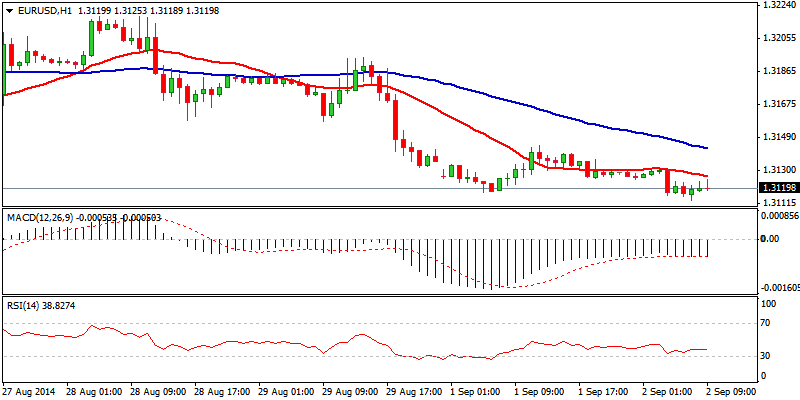
EUR/JPY
The pair regained strength and bounced strongly from 136.50 zone, where higher base is forming. Rally so far retraced over 76.4% of 137.98/136.40 descend, with near-term focus being shifted towards the upside again, as lower time frame technicals turned bullish. Return to pivotal 138 resistance zone also the upper boundary of short-term congestion, would signal fresh upside on a break, which is also required to confirm base, for stronger reversal of larger 145.67/135.71 descend. Sustained break above 138 hurdle, opens immediate barrier at 138.21, daily cloud top, ahead of lower tops at 138.74 and 139.26. Corrective actions on overbought hourly studies should be ideally contained at 137 support zone, to keep freshly established bulls in play.
Res: 138.00; 138.43; 138.74; 139.00
Sup: 137.40; 137.17; 137.00; 136.85 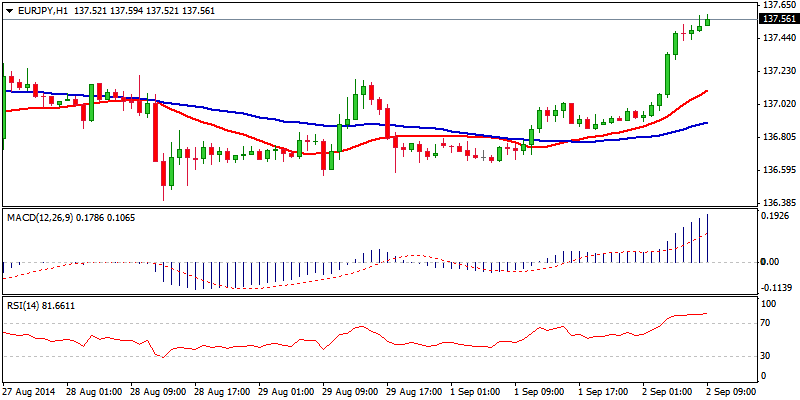
GBP/USD
Near-term studies are losing initial strength, regained on a bounce off 1.6534, as the pair failed to sustain gains above the first breakpoint at 1.66 zone, as fresh weakness followed the price’s stall at 1.6642. Extension below 1.66 handle, weakens near-term structure and risks return to 1.6534 base, as reversal retraced so far over 76.4% of 1.6534/1.6642 ascend, in case near-term price action took out the last support at 1.6560. Underlying bearish tone favors fresh resumption of larger downtrend, as 20/200S MA death cross maintains the pressure. Extension below 1.6534 to open 1.6500 and higher low at 1.6464 next.
Res: 1.6587; 1.6613; 1.6642; 1.6677
Sup: 1.6542; 1.6534; 1.6500; 1.6464 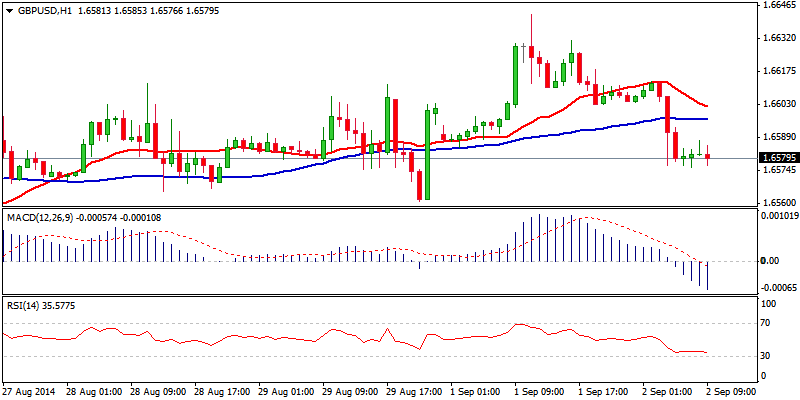
USD/JPY
The pair accelerated higher, after clearing near-term top at 104.26, rallying towards psychological 105 and key short-term barrier at 105.43, 02 Jan peak. Overall bullish structure favors attempts through 105.43 and resumption of multi-year uptrend, which was interrupted by 105.43/100.74 corrective phase. However, overbought conditions on all time frames may cause hesitation ahead of 105.43 barrier. Former resistances at 104.26/00 zone, offer initial supports.
Res: 105.00; 105.43; 105.57; 106.00
Sup: 104.26; 104.00; 103.80; 103.50 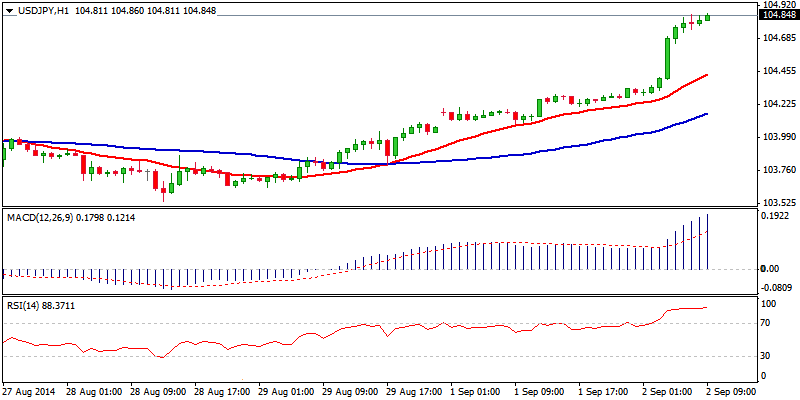
AUD/USD
The pair lost traction and slumped below 0.93 support, after recovery attempts failed to clear pivotal 0.9372 barrier and subsequent weakness accelerated after losing important 0.9320 support and previous consolidation floor. Retracement of over 61.8% of 0.9236/0.9372 upleg, has weakened near-term structure, near-term indicators are in the negative territory. Corrective action on oversold hourlies is expected to precede fresh weakness towards higher low at 0.9268, with return to 0.9236 base, seen on extension. Alternative scenario requires lift above lower top at 0.9350, to bring bulls back in play for renewed attempts at 0.9372 barrier.
Res: 0.9300; 0.9322; 0.9350; 0.9361
Sup: 0.9282; 0.9268; 0.9236; 0.9200 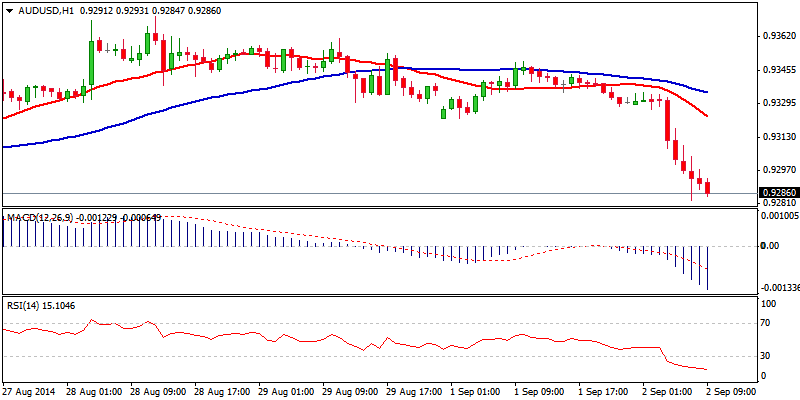
AUD/NZD
The pair extends near-term consolidative phase under fresh highs, where acceleration from 1.1055 higher base was temporarily capped, ticks away from psychological 1.1200 barrier. Temporary support at 1.1125, has been cracked, which could signal deeper pullback on sustained break lower and violation of 1.11 support, as hourly studies are negative and 4-hour indicators probing below their midlines. Confirmation of such scenario would require break below 1.1086, Fibonacci 38.2% of 1.0922/1.1187 ascend. Otherwise, prolonged consolidative phase is likely to precede fresh attempts through 1.1200 barrier and extend larger bull-trend off 1.0619.
Res: 1.1150; 1.1174; 1.1187; 1.1200
Sup: 1.1117; 1.1100; 1.1086; 1.1055 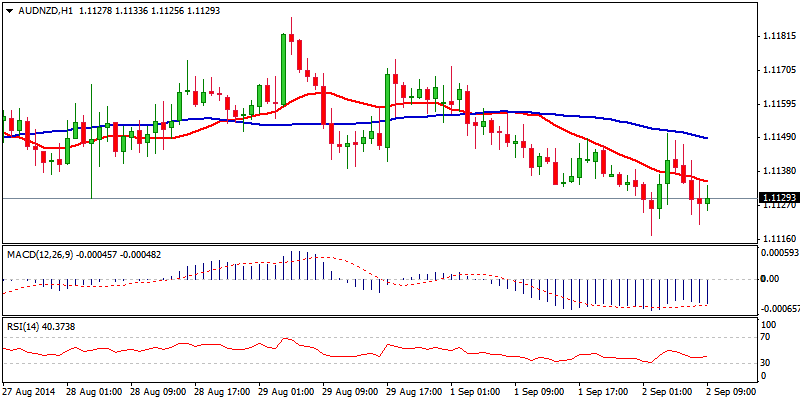
XAU/USD
Spot Gold has lost initial bullish tone and near-term structure turned bearish, as corrective action off fresh high at 1296, accelerated lower and broke below important supports at 1283 and 1280. As the price nearly fully retraced 1272/1296 corrective rally, immediate focus is shifted towards 1272 support and resumption of larger downtrend from 1344 seen on a break lower. Extension below 1272 to re-open short-term targets at 1265 and 1258, with key 1240 low, expected to be focused on a violation of the latter. Former support, now act as immediate barriers, with lower top at 1289, seen as ideal cap.
Res: 1280; 1283; 1289; 1296
Sup: 1272; 1265; 1258; 1250 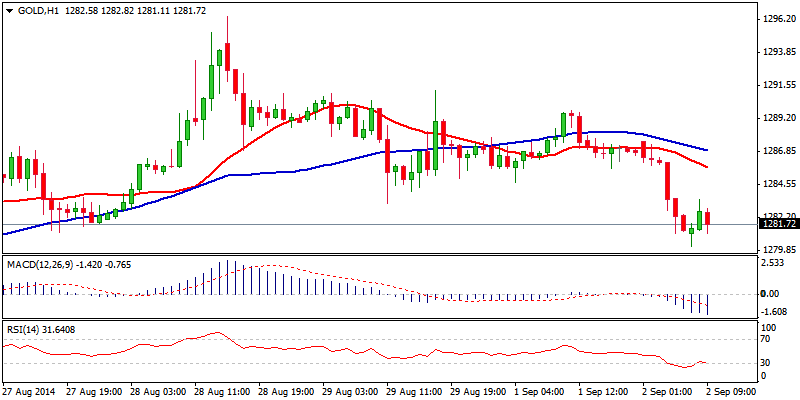
- English (UK)
- English (India)
- English (Canada)
- English (Australia)
- English (South Africa)
- English (Philippines)
- English (Nigeria)
- Deutsch
- Español (España)
- Español (México)
- Français
- Italiano
- Nederlands
- Português (Portugal)
- Polski
- Português (Brasil)
- Русский
- Türkçe
- العربية
- Ελληνικά
- Svenska
- Suomi
- עברית
- 日本語
- 한국어
- 简体中文
- 繁體中文
- Bahasa Indonesia
- Bahasa Melayu
- ไทย
- Tiếng Việt
- हिंदी
Euro Remains Weak, USD/JPY Regained Strength
Published 09/02/2014, 04:26 AM
Updated 02/21/2017, 08:25 AM
Euro Remains Weak, USD/JPY Regained Strength

FinFX
Latest comments
Install Our App
Risk Disclosure: Trading in financial instruments and/or cryptocurrencies involves high risks including the risk of losing some, or all, of your investment amount, and may not be suitable for all investors. Prices of cryptocurrencies are extremely volatile and may be affected by external factors such as financial, regulatory or political events. Trading on margin increases the financial risks.
Before deciding to trade in financial instrument or cryptocurrencies you should be fully informed of the risks and costs associated with trading the financial markets, carefully consider your investment objectives, level of experience, and risk appetite, and seek professional advice where needed.
Fusion Media would like to remind you that the data contained in this website is not necessarily real-time nor accurate. The data and prices on the website are not necessarily provided by any market or exchange, but may be provided by market makers, and so prices may not be accurate and may differ from the actual price at any given market, meaning prices are indicative and not appropriate for trading purposes. Fusion Media and any provider of the data contained in this website will not accept liability for any loss or damage as a result of your trading, or your reliance on the information contained within this website.
It is prohibited to use, store, reproduce, display, modify, transmit or distribute the data contained in this website without the explicit prior written permission of Fusion Media and/or the data provider. All intellectual property rights are reserved by the providers and/or the exchange providing the data contained in this website.
Fusion Media may be compensated by the advertisers that appear on the website, based on your interaction with the advertisements or advertisers.
© 2007-2024 - Fusion Media Limited. All Rights Reserved.