The euro maintains negative tone and trends lower, with fresh one-year low being posted at 1.3149. Near-term price action keeps focus on targets at targets at 1.3103, Sep 2013 higher low and 1.3022, Fibonacci 138.2% expansion of the wave from 1.3699, with psychological 1.3000 in extension. Oversold conditions, however, suggest corrective action ahead of fresh weakness, with week’s high at 1.3213, offering solid resistance and expected to cap, to keep immediate bears intact. Otherwise, filling the gap of week’s opening, on extension higher, would signal stronger corrective rally towards 1.3240, Fibonacci 61.8% retracement of 1.3295/1.3149 descend / 21 Aug low and 1.3261, lower top, above which to open key 1.3295, 22 Aug high.
Res: 1.3213; 1.3240; 1.3261; 1.3295
Sup: 1.3149; 1.3103; 1.3050; 1.3022 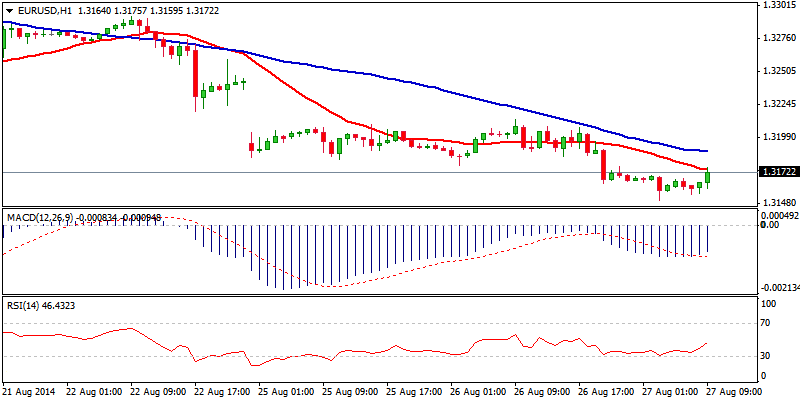
EUR/JPY
The pair remains under pressure and extended pullback off fresh high at 137.98 below psychological 137 support, to test 136.80, the lower border of pivotal 137.00/136.80 support zone, also 50% retracement of 135.71/137.98 rally. Weak near-term structure sees increased risk of further retracement of 135.71/137.98 upleg, with extension below 136.80 higher base, required to confirm scenario. Completion of Three Black Crows reversal pattern supports the notion and focuses 136.57, Fibonacci 61.8% and higher low of 12 Aug at 136.35. Corrective rallies should ideally hold below 137.30/40, broken bear-trendline off 137.98 / 26 Aug lower top.
Res: 137.00; 137.30; 137.40; 137.65
Sup: 136.80; 136.57; 136.35; 136.00 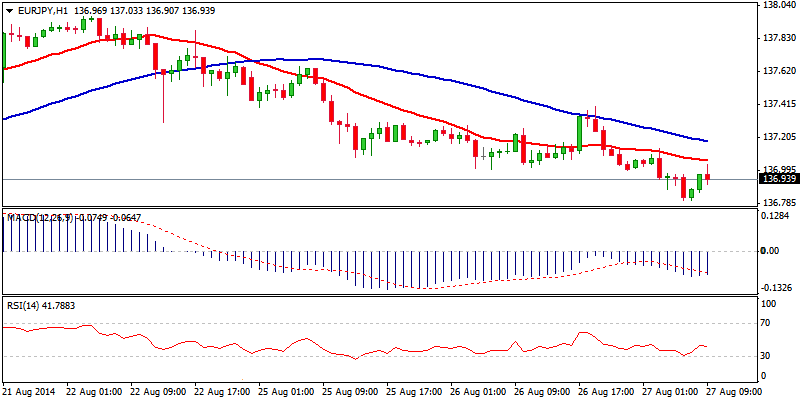
GBP/USD
Cable came under pressure and fully reversed near-term corrective rally off 1.6534, which stalled at strong 1.66 resistance zone. Overall negative structure favors fresh weakness, which is going to focus psychological 1.6500, support and 1.6464, 24 Mar low, as immediate targets, once temporary base at 1.6534 is broken. However, subsequent bounce off 1.6534, signals prolonged sideways trading, with 1.66 barrier expected to cap. Only break here would confirm near-term base and signal stronger recovery action.
Res: 1.6600; 1.6622; 1.6651; 1.6677
Sup: 1.6534; 1.6500; 1.6464; 1.6400 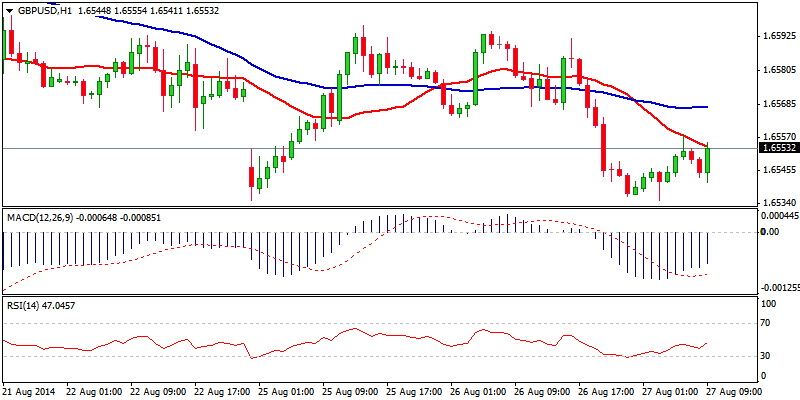
USD/JPY
The pair maintains overall bullish tone, as fresh bulls cracked key 104.11, 04 Apr peak, the last obstacle on the way to 105.43, 02 Jan peak. Near-term price action moves in consolidative mode, with attempts below initial 104 support, being so far contained at 103.70 zone and extended pullback to face supports at 103.50, 22 Aug low and 103.20, Fibonacci 38.2% of 101.49/104.26 upleg, where dips should be contained, to keep bulls intact.
Res: 104.16; 104.26; 104.50; 104.83
Sup: 103.70; 103.50; 103.20; 103.07 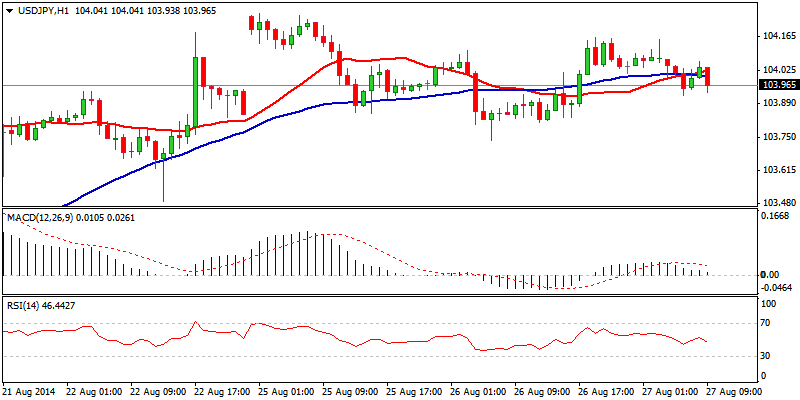
AUD/USD
Near-term bulls returned to play, as the price fully retraced corrective 0.9327/0.9269 descend, with probe above 0.9327, opening 0.9342, 19 Aug high and key 0.9372, peak of 06 Aug. Positively aligned near-term technicals favor further upside, as daily studies are building up bullish momentum. However, break above 0.9372 is required to confirm base at 0.9237 for more significant correction of 0.9503/0.9237 descend. Otherwise, prolonged sideways trade could be expected in the near-term, in case of failure to break 0.9372 barrier. Minor higher base at 0.9290 offers initial support and should ideally hold dips, to maintain bullish scenario.
Res: 0.9342; 0.9372; 0.9400; 0.9440
Sup: 0.9308; 0.9290; 0.9270; 0.9237 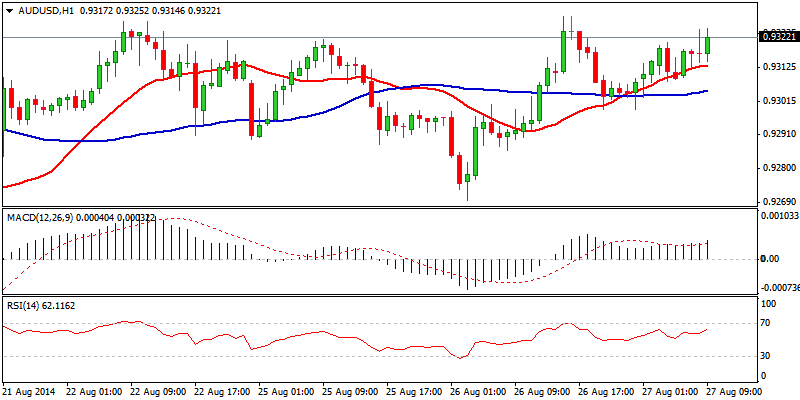
AUD/NZD
The pair resumes larger uptrend off 1.0619, 10 July low, after fresh acceleration from 1.1055 higher base, eventually broke above psychological 1.1100 barrier and took out the next target at 1.1160, Fibonacci 61.8% retracement of 1.1576/1.0488 descend. Daily close above here supports the scenario of testing 1.1200, round figure resistance and previous July/Sep 2013 lower base, ahead of 1.1300/19, round figure/Fibonacci 76.4% retracement. Initial support at 1.1125, so far contained dips, with further easing to face psychological 1.1100 level, also Fibonacci 61.8% of 1.1055/1.1183 upleg, where extended dips should find support.
Res: 1.1160; 1.1183; 1.1200; 1.1250
Sup: 1.1125; 1.1100; 1.1081; 1.1055 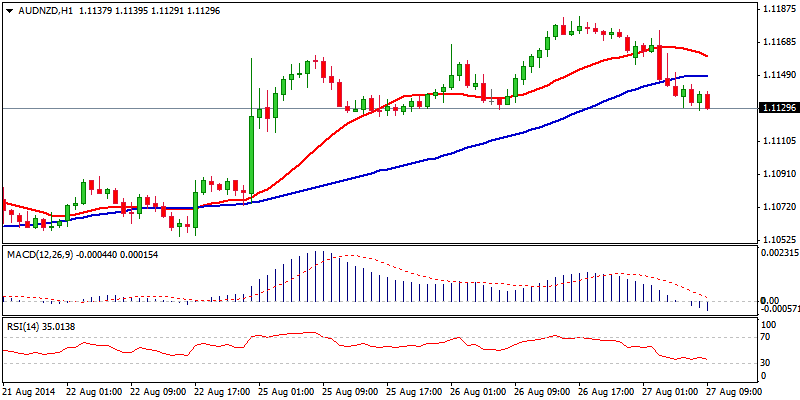
XAU/USD
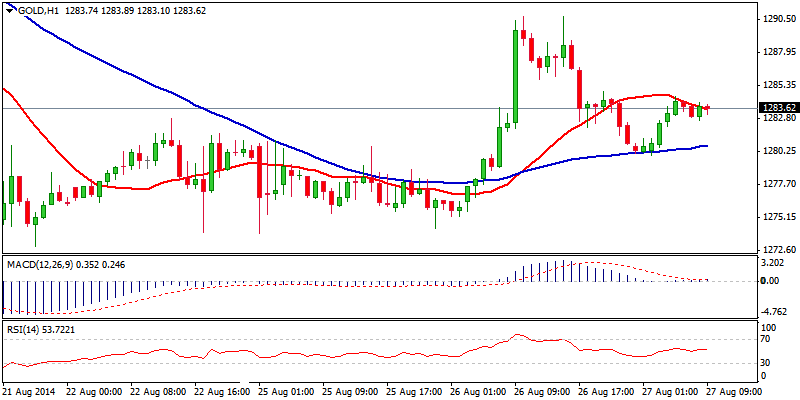
Spot Gold’s bounce off fresh lows at 1272, retraced 38.2% of 1319/1272 downleg , on a rally to 1290 so far.. Extension above 200SMA at 1284, signals fresh recovery action, with regain of broken bull trendline and psychological support at 1300, required to confirm formation of near-term base. Corrective pullback off 1290, found support at previos consolidation top at 1280, which keeps freshly established near-term bulls in play. Positive hourly studies are supportive, however, weak tone, which persists on larger timeframes, warns of fresh weakness, in case of failure to clearly break above 1300 barrier.
Res: 1290; 1296; 1300; 1305
Sup: 1284; 1280; 1272; 1265 