Get 40% Off
🚨 Volatile Markets? Find Hidden Gems for Serious OutperformanceFind Stocks Now

Euro Historic And Implied Volatility

Published 09/11/2014, 12:30 AM
Updated 07/09/2023, 06:31 AM

GBP/USD Daily

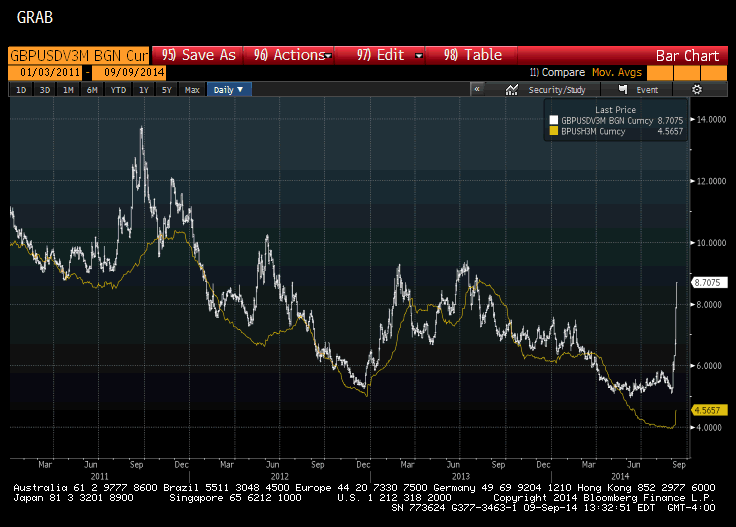
This Great Graphic was created on Bloomberg. It shows the jump in the three-month implied volatility (white line). It bottomed in mid-July near 4.75%.

By the end of August, it was testing 6.0%. Since the ECB's rate cuts and announcement of an ABS/covered bond purchases scheme (without any meaningful details), the implied volatility has jumped higher.  It is near 7.5% presently. 

When we reviewed sterling volatility, the jump in implied volatility seemed to reflect the demand for option protection. Sterling's vol curve is inverted, with the short-dated implied volatility higher than the longer-dates. The euro vol curve is flatter in contrast.  This, coupled with the fact that the euro and implied vol are the most inversely correlated since 2012, suggests that the increase in implied euro volatility is an expression of the bearishness.

The demand for euro puts is evident in the pricing of the risk-reversals. First, it is notable that puts have been at a premium to calls since late-2009.  Second, in late-August the premium for puts narrowed to about 0.55%, which the lower end of this year's range.  Earlier today, the premium rose to more than 0.90%, which is the most since early February. 

Historic volatility (yellow line) remains very low.  Excluding the brief period in late August and early September, historic volatility remains near record lows.  The gap between the implied and historic volatility is large but not unprecedented. The gap was larger, for example, in the middle of 2012.  However, there does not seem to be a compelling pattern of converge after a large gap.  Sometimes the historic has risen and sometime the actual has fallen. 

3rd party Ad. Not an offer or recommendation by Investing.com. See disclosure here or remove ads .

Latest comments

Risk Disclosure: Trading in financial instruments and/or cryptocurrencies involves high risks including the risk of losing some, or all, of your investment amount, and may not be suitable for all investors. Prices of cryptocurrencies are extremely volatile and may be affected by external factors such as financial, regulatory or political events. Trading on margin increases the financial risks.
Before deciding to trade in financial instrument or cryptocurrencies you should be fully informed of the risks and costs associated with trading the financial markets, carefully consider your investment objectives, level of experience, and risk appetite, and seek professional advice where needed.
Fusion Media would like to remind you that the data contained in this website is not necessarily real-time nor accurate. The data and prices on the website are not necessarily provided by any market or exchange, but may be provided by market makers, and so prices may not be accurate and may differ from the actual price at any given market, meaning prices are indicative and not appropriate for trading purposes. Fusion Media and any provider of the data contained in this website will not accept liability for any loss or damage as a result of your trading, or your reliance on the information contained within this website.
It is prohibited to use, store, reproduce, display, modify, transmit or distribute the data contained in this website without the explicit prior written permission of Fusion Media and/or the data provider. All intellectual property rights are reserved by the providers and/or the exchange providing the data contained in this website.
Fusion Media may be compensated by the advertisers that appear on the website, based on your interaction with the advertisements or advertisers.
© 2007-2024 - Fusion Media Limited. All Rights Reserved.