GROWTHACES.COM Forex Trading Strategies
Taken Positions
USD/JPY: long at 123.70, target 125.80, stop-loss 122.90, risk factor *
Pending Orders
EUR/USD: sell at 1.0960, target 1.0750, stop-loss 1.1030, risk factor *
USD/CHF: buy at 0.9710, target 0.9940, stop-loss 0.9640, risk factor *
USD/CAD: buy at 1.3100, target 1.3275, stop-loss 1.3040, risk factor *
AUD/USD: sell at 0.7500, target 0.7250, stop-loss 0.7600, risk factor *
NZD/USD: sell at 0.6590, target 0.6405, stop-loss 0.6660, risk factor *
EUR/GBP: sell at 0.7070, target 0.6905, stop-loss 0.7120, risk factor *
EUR/CHF: buy at 1.0600, target 1.0795, stop-loss 1.0520, risk factor *
GBP/JPY: buy at 192.90 , target 196.40, stop-loss 191.80, risk factor **
Subscribe to our daily forex newsletter to receive forex analysis and trading strategies.
EUR/USD: Watch ADP And ISM Today
(sell at 1.0960)
- Atlanta Federal Reserve President Dennis Lockhart has said it would take “significant deterioration” in the US economy for him to not support a rate hike in September. His comments add weight to the likelihood of a September rate hike. Lockhart is considered a centrist on the Fed's policy-setting Federal Open Market Committee, and is one of the five regional bank presidents who has a vote on the panel this year.
- Lockhart has maintained for many months that the US economy is strong enough to begin rate normalization. In a February 6 speech he stated: "As of today, I remain comfortable with the assumption that circumstances will come together around mid-year, or a little later, that will deliver sufficient confidence to begin normalization with the liftoff decision."
- Dennis Lockhart's comments supported the USD bulls. But the market indicating only a 50% chance of liftoff in September and the odds of a hike then are still seen hinging on Friday's US non-farm payrolls data. Before that, the ADP employment (12:15 GMT) and ISM non-manufacturing (14:00 GMT) surveys will be in focus to give investors an idea about whether the economy and employment growth was picking up.
- The Commerce Department said US new orders for manufactured goods increased 1.8% after a revised 1.1% decline in May. The increase was in line with economists' expectations. May factory orders were previously reported to have dropped 1.0%. Orders for transportation equipment surged 9.3% in June, reflecting strong demand for aircraft.
- What is important, shipments of these so-called core capital goods, which are used to calculate business equipment spending in the gross domestic product report, increased 0.3% in June. Shipments were previously reported to have dipped 0.1%. The upward revisions to core capital goods shipments, combined with a report on Monday showing stronger construction spending in May than previously reported, suggest second-quarter GDP could be revised higher when the government publishes its second estimate. Last-week data showed US GDP growth in the second quarter at 2.3% qoq annualized.
- Eurozone PMI composite index posted 53.9 in July, down from 54.2 in June and above the earlier flash estimate of 53.7. Solid expansions of output were signalled in both the manufacturing and service sectors, with the slightly faster rate of growth at service providers. Based on the recent survey data, Eurozone GDP looks set to have risen by 0.4% in the second quarter. PMI suggested that the Eurozone continued to expand at a solid pace at the start of the third quarter and even faster growth could soon be achieved providing the Greek situation remains under control.
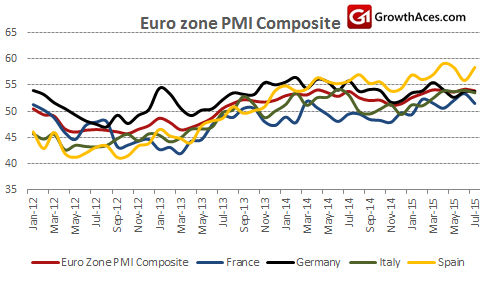
- Eurozone retail sales have come in soft, down 0.6% mom vs. expectations of a 0.3% drop, from the 0.2% gain seen in May. The yoy figure has fallen back to 1.2%, from 2.4% and vs. expectations of 1.9%.
- The EUR/USD dropped significantly after yesterday’s Lockhart’s comments and the momentum remains bearish despite surprisingly strong jump in the EUR/USD on Friday. In our opinion the EUR/USD is likely to break below the 1.0810 support level soon and our trading strategy is to sell on upticks.
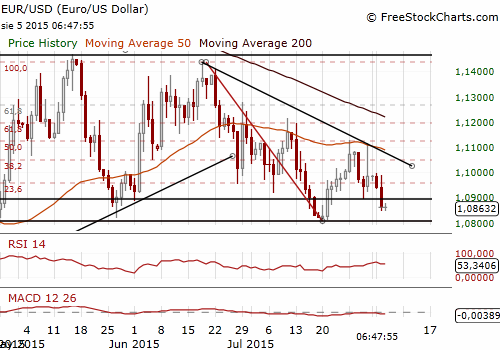
Significant technical analysis' levels:
Resistance: 1.0894 (session high Aug 5), 1.0971 (10-dma), 1.0988 (high Aug 4)
Support: 1.0812 (low Jul 21), 1.0808 (low Jul 20), 1.0785 (low Apr 24)
USD/CHF: Deepest Swiss Deflation Since 1959
(buy at 0.9710)
- Swiss consumer prices dropped 0.6% MoM and 1.3% YoY in July, more than the 1.0% they fell in June and the market forecast of a 1.1% drop. It was the steepest yoy consumer prices fall since 1959. The monthly decrease was mainly due to lower prices for clothing and new cars. Heating oil and hotel stays were also cheaper. Petrol prices rose.
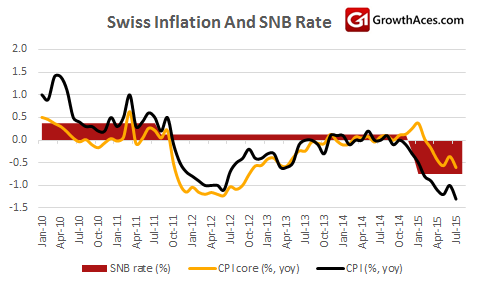
- The main source of deflation is strong CHF that lowers the price of imports into Switzerland from the Eurozone. The central bank has said it expects prices to fall this year and in 2016.
- Swiss CPI inflation data up the ante for the Swiss National Bank’s September meeting. The CHF did not react to CPI data, so the market does not expect any move from the central bank.
- The USD/CHF is likely to go up further on carry trade. The Fed is likely to begin its monetary tightening soon, while CHF funding is still in fashion. We have placed buy USD/CHF order at 0.9710.
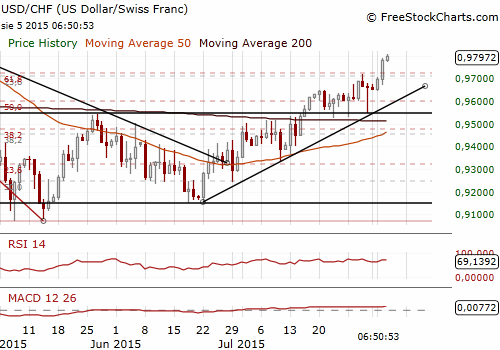
Significant technical analysis' levels:
Resistance: 0.9862 (high Apr 13), 0.9906 (high Mar 20), 0.9982 (high Mar 19)
Support: 0.9774 (session low Aug 5), 0.9677 (10-dma), 0.9670 (low Aug 4)
NZD/USD: Weaker New Zealand’s Job Report Reinforces Bearish Structure
(sell at 0.6590)
- New Zealand's jobless rate rose to 5.9% in the second quarter as growth in the labour force outstripped the number of jobs created, while wage rates rose moderately as expected. Employment growth was 0.3% qoq or about 7k, below median forecast for 0.5% qoq gain. The participation rate fell to 69.3%.
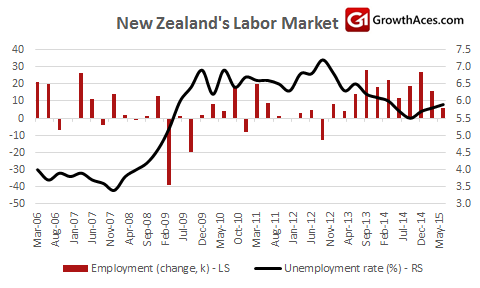
- Wages data showed a 0.5% qoq and 1.8% yoy lift in private sector, in line with market expectations.
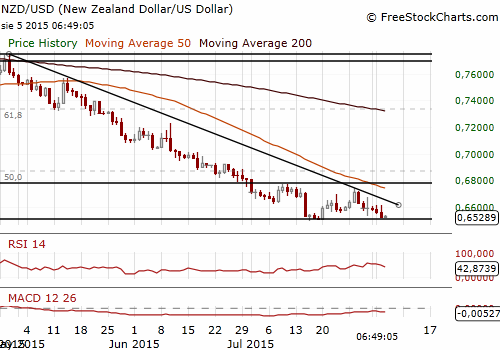
- Last month the Reserve Bank of New Zealand cut its cash rate to 3.0% in the face of a slowing economy and low inflation and said more easing seemed likely. In our opinion another 25 bp cut is likely next month.
- We have lowered our offer to 0.6590, which is ahead of 10-day moving average at 0.6597. 10- and 30-day moving averages are negatively aligned, reinforcing the bearish market structure.
Significant technical analysis' levels:
Resistance: 1.0894 (session high Aug 5), 1.0971 (10-dma), 1.0988 (high Aug 4)
Support: 1.0812 (low Jul 21), 1.0808 (low Jul 20), 1.0785 (low Apr 24)
