US traders are dragging themselves to work for a holiday-shortened week, though they are likely to have increasingly urgent daydreams about Thursday’s coming gluttony and tryptophan-induced afternoon naps as the week goes on. Lest we get too distracted though, there will be a number of significant economic releases in the first half of the week, including US housing data (both later this morning and on Wednesday), German IFO survey figures, “preliminary” Q3 US GDP data, consumer confidence and durable goods orders.
Indeed, the market-moving economic data kicked off early in today’s European trading session with PMI figures out of the Eurozone. Both the manufacturing and services PMI reports beat expectations, with the manufacturing reading coming in at 52.8 (vs. 52.3 expected) and the services reading printing at 54.6 (vs. 54.2 eyed). The manufacturing reading was the highest since April 2014, while the services report incredibly saw its highest headline number in four and a half years!
While these reports represent the most timely, on-the-ground reading of economic conditions in the single currency zone, we’re tempering our enthusiasm about what they could mean for ECB policy and the euro. After all, ECB policymakers have been unanimous in suggesting that the central bank is leaning toward expanding its stimulus program in order to fight deflation. To that end, ECB President Draghi’s pledge late last week that the ECB would “do what [it] must to raise inflation as quickly as possible” still points to more easing action, notwithstanding today’s better-than-anticipated PMI reports.
Technical view: EUR/USD
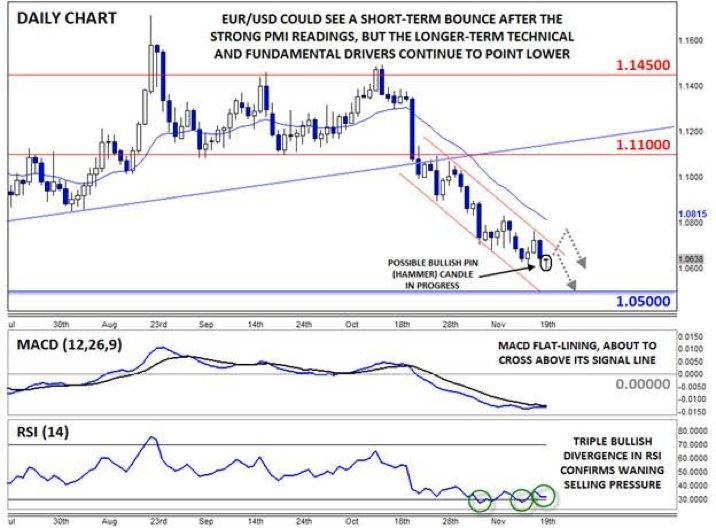
Turning our attention to the charts, EUR/USD has seen a bit of intraday bounce after the PMI readings. After briefly peeking out to a new 7-month low beneath 1.0600, rates have since bounced back to 1.0640. While it’s far from the end of the day, the daily chart is showing a possible Bullish Pin candle*, or hammer, that could hint at a shift from selling to buying pressure.
At the same time, the secondary indicators are also showing nascent signs of turning higher. The MACD has flat-lined and is now on the verge of crossing above its signal line, while the RSI indicator has actually formed a triple bullish divergence with price. In other words, the indicator has made three (marginal) higher lows, while the exchange rate itself has put in three lower lows, signaling waning bearish momentum.
Given the current technical and fundamental situations, bulls could make a case for a near-term rally in EUR/USD, but the longer-term outlook remains bleak. To the topside, the top of the near-term bearish channel sits around 1.0720, but even if that level is broken, the descending 20-day MA at 1.0815 could cap any rallies. Meanwhile, strong previous support down at 1.0500 could put a floor under rates ahead of the ECB’s fateful meeting on December 3.
* A Bullish Pin (Pinnochio) candle, also known as a hammer or paper umbrella, is formed when prices fall within the candle before buyers step in and push prices back up to close near the open. It suggests the potential for a bullish continuation if the high of the candle is broken.

Source: FOREX.com
