Get 40% Off
🚨 Volatile Markets? Find Hidden Gems for Serious OutperformanceFind Stocks Now

EUR/USD: Market Remains Grounded; GBP/USD: Buyers At Mid Day Support

Published 09/17/2014, 03:53 AM
Updated 07/09/2023, 06:31 AM

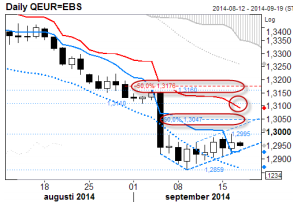
EUR/USD: Sellers just above resistance.

The market remains grounded as the brief attempt over 1.2990 was responded to (at the intraday stretch). Time spent outside 1.2908-1.2995 is needed to show next directional attempt. Current intraday stretches are located at 1.2905 & 1.3000.  

EUR/USD Daily Chart

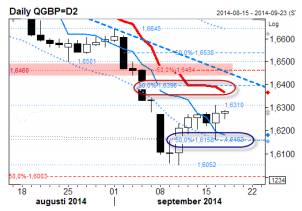
GBP/USD: Buyers at mid-body support.

Yesterday's intraday dip ran into mid-body bids. The fresh near-term high closed the gap which remained open since the weekend before last and it sends near-term bullish vibes. But the next set of resistance refs at 1.6365/1.6395 is thought to temper any pre-referendum rally. Back below 1.6160 would be renewed short-term bearish. Current intraday stretches are located at 1.6200 & 1.6315.

GBP/USD Daily Chart

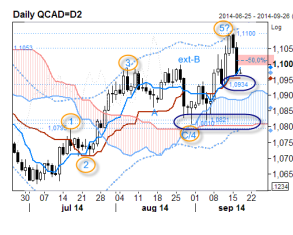
USD/CAD: Sharply down from the prior stretch.

Notable selling kicked in yesterday and it accelerated after strong Canadian manufacturing numbers and a CB speech not complaining over a strong currency. Supports at 1.0955 & 1.0934 are under pressure and if broken, extension towards 1.0821/10 must be penciled in. First-hand resistance is located at yesterday's mid-body point at 1.1015. Current intraday stretches are located at 1.0955 & 1.1030.

USD/CAD Daily Chart

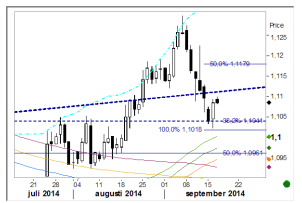
AUD/NZD: Bouncing from the equality point.

We came within seven pips from the 1.1018 key support before the anticipated upward reaction begun. 1.1018 is still, as explained yesterday, a major hurdle re-establishing the longer term bear trend (and if the decline in fact is a downside correction and not a resumption of the bear trend, well then the reaction should end at...1.1018). Our view is that the current bounce has potential for 1.1180 (above 1.1225 we will be wrong and new highs underway). 

3rd party Ad. Not an offer or recommendation by Investing.com. See disclosure here or remove ads .

AUD/NZD Daily Chart

Original post

Latest comments

Risk Disclosure: Trading in financial instruments and/or cryptocurrencies involves high risks including the risk of losing some, or all, of your investment amount, and may not be suitable for all investors. Prices of cryptocurrencies are extremely volatile and may be affected by external factors such as financial, regulatory or political events. Trading on margin increases the financial risks.
Before deciding to trade in financial instrument or cryptocurrencies you should be fully informed of the risks and costs associated with trading the financial markets, carefully consider your investment objectives, level of experience, and risk appetite, and seek professional advice where needed.
Fusion Media would like to remind you that the data contained in this website is not necessarily real-time nor accurate. The data and prices on the website are not necessarily provided by any market or exchange, but may be provided by market makers, and so prices may not be accurate and may differ from the actual price at any given market, meaning prices are indicative and not appropriate for trading purposes. Fusion Media and any provider of the data contained in this website will not accept liability for any loss or damage as a result of your trading, or your reliance on the information contained within this website.
It is prohibited to use, store, reproduce, display, modify, transmit or distribute the data contained in this website without the explicit prior written permission of Fusion Media and/or the data provider. All intellectual property rights are reserved by the providers and/or the exchange providing the data contained in this website.
Fusion Media may be compensated by the advertisers that appear on the website, based on your interaction with the advertisements or advertisers.
© 2007-2024 - Fusion Media Limited. All Rights Reserved.