EUR/USD: Fed Will Probably Signal No Hurry To Raise Rates
- The Conference Board said its consumer index was 97.3 this month after a reading of 97.4 in June. The market had expected the index to drop to 95.9 in July. The largely unchanged reading followed Britain's stunning vote last month to leave the European Union, which rattled global financial markets and led to a dip in other consumer sentiment measures. The survey's so-called labor market differential, which closely correlates to the jobless rate in the employment report, improved this month after slipping in June.
- In a separate report US Commerce Department said new home sales increased 3.5% to a seasonally adjusted annual rate of 592k units last month, the highest level since February 2008. Economists had forecast new home sales, which account for about 9.6% of the housing market, rising to a rate of 560k units last month. Sales were up 25.4% from a year ago. Last month's increase left new home sales in the second quarter well above their average for the first three months of the year. The housing market is gaining speed with a report last week showing home resales vaulted to near a 9-and-a-half-year high in June. At the same time, single-family housing starts increased solidly in June. New home sales are likely benefiting from a persistent shortage of previously owned houses available for sale.
- A third report on Tuesday showed the S&P CoreLogic Case-Shiller composite index of 20 metropolitan areas rose 5.2% in May on a year-over-year basis. Prices rose 5.4% in April.
- The reports joined a slew of data, ranging from retail sales to manufacturing and services sector surveys, in painting a bright picture of US economy.
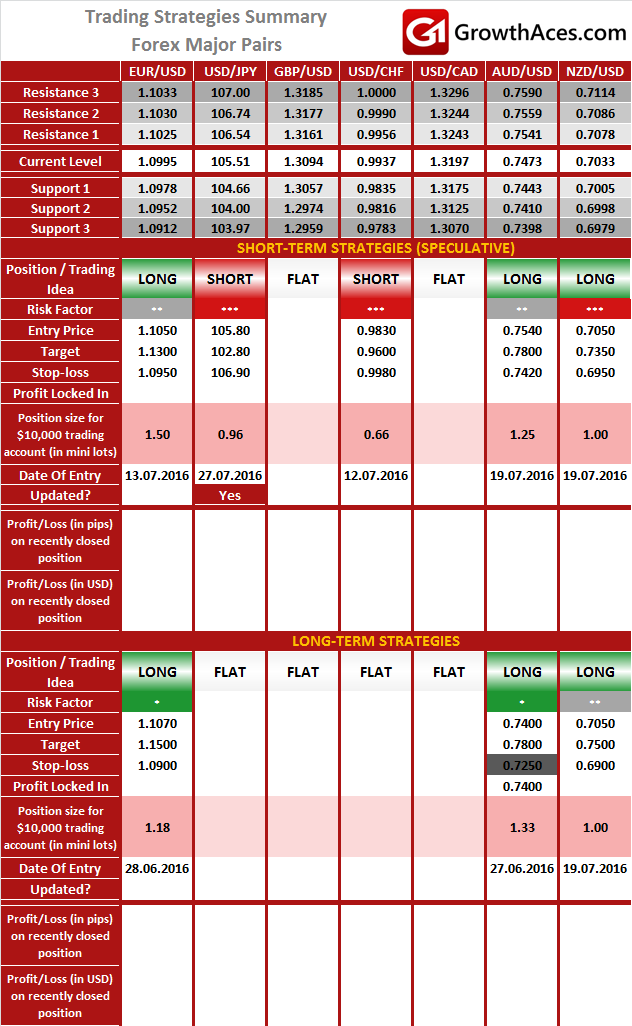
- The day's big set piece is the US Federal Reserve's statement on policy. The USD stays strong since June 23, when Britons voted for Brexit, but we think that some of these gains will likely be trimmed a bit in the aftermath of the FOMC meeting outcome today, as the Fed, while acknowledging the improved economic data in the US, will unlikely signal an impending rate hike. As a result, we expect the EUR/USD will break above 1.1000 and will further consolidate above this threshold. Our medium-term EUR/USD remains slightly bullish, given still-persisting USD overvaluation.
USD/JPY: Government Stimulus Plan Put Pressure On BoJ To Ease
- Japan's prime minister Shinzo Abe unveiled a surprisingly large USD 265 billion stimulus package on Wednesday, adding pressure on the central bank to match the measures with monetary stimulus later this week.
- The earlier-than-expected announcement to boost the flagging economy sent Japanese and other Asian stock markets higher while it weighed on the safe-haven yen, but lacked crucial details on how much of the package would be direct government spending.
- The size of the package, at more than JPY 28 trillion, exceeds initial estimates of around JPY 20 trillion and is nearly 6% the size of Japan's economy. It will consist of JPY 13 trillion in "fiscal measures," which likely includes spending by national and local governments, as well as loan programmes. But the rest is likely to come from state subsidies to private firms and lending from quasi-government entities, which does not involve direct government spending and thus may not give an immediate boost to growth. Abe's administration has also offered few hints on how it will finance the package, casting doubts on Japan's ability to fix its tattered finances.
- The market expects the Bank of Japan to produce some fire power of its own at its rate review ending on Friday. Many BOJ policymakers prefer to hold off on easing as they expect the fiscal stimulus package to boost growth and brighten the prospects for hitting their 2% inflation target. But yen moves and political considerations could be decisive factors for the BOJ policymakers.
- We opened USD/JPY short at 105.80. A volatile session in Asia means this strategy is risky and a wide stop is needed.
AUD/USD Slipped On Lower Inflation Data
- Australian headline inflation amounted to 1.0% yoy in the second quarter vs. 1.3% yoy in the first quarter. The market had expected a reading of 1.1% yoy. CPI is well below the Reserve Bank of Australia's target band of 2 to 3%.
- The biggest price gains in the second quarter came in healthcare, petrol, tobacco and new home purchases. That was balanced by falls in domestic holiday travel and accommodation, motor vehicles and telecoms.
- The central bank had already cut rates to an all-time low of 1.75% in May following an alarmingly weak inflation report for the first quarter. The market now looks for a cut at the RBA's next meeting on August 2.
- In our opinion today's CPI is enough to get the RBA across the line for a cut in August, but the low scale of downward surprise today and better recent data make this a closer call. The AUD/USD was volatile after the inflation release. The AUD/USD jumped as high as 0.7568 after the report, but fell to 0.7461 soon. The AUD/USD may stay under pressure before the RBA meeting on August 2.
FOREX - MAJOR PAIRS: 
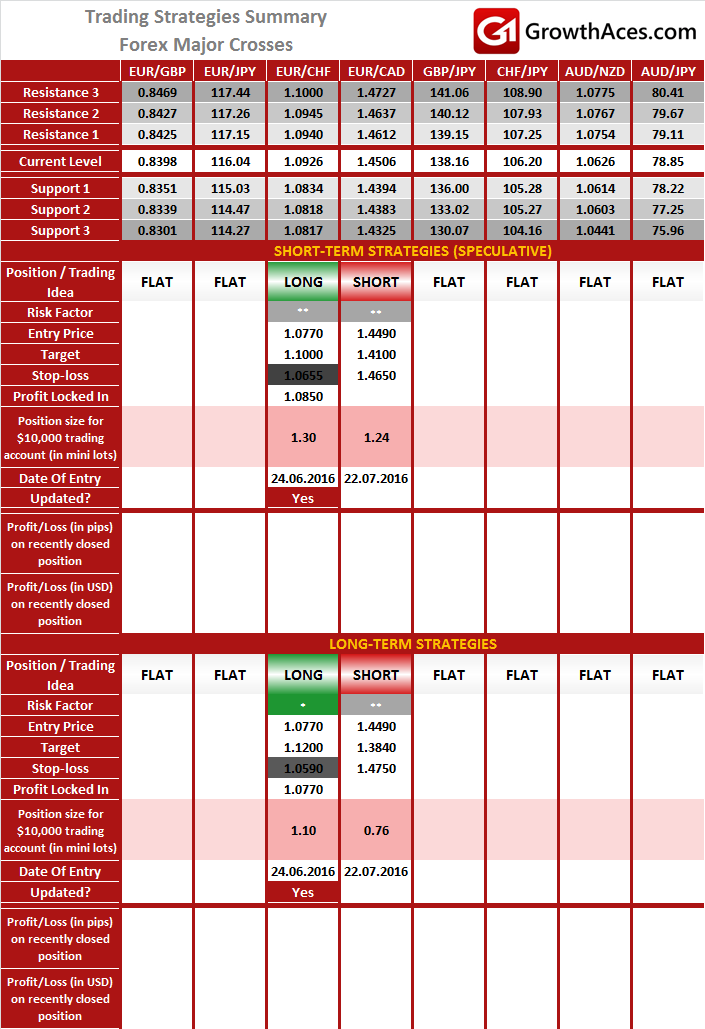
FOREX - MAJOR CROSSES: 
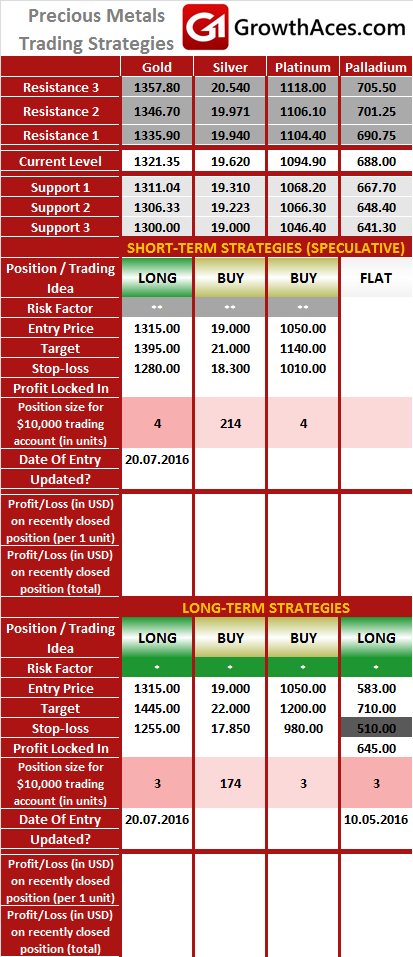
PRECIOUS METALS: 
It is usually reasonable to divide your portfolio into two parts: the core investment part and the satellite speculative part. The core part is the one you would want to make profit with in the long term thanks to the long-term trend in price changes. Such an approach is a clear investment as you are bound to keep your position opened for a considerable amount of time in order to realize the profit.
The speculative part is quite the contrary. You would open a speculative position with short-term gains in your mind and with the awareness that even though potentially more profitable than investments, speculation is also way more risky. In typical circumstances investments should account for 60-90% of your portfolio, the rest being speculative positions.
This way, you may enjoy a possibly higher rate of return than in the case of putting all of your money into investment positions and at the same time you may not have to be afraid of severe losses in the short-term.
How to read these tables?
1. Support/Resistance - three closest important support/resistance levels
2. Position/Trading Idea:
BUY/SELL - It means we are looking to open LONG/SHORT position at the Entry Price. If the order is filled we will set the suggested Target and Stop-loss level.
LONG/SHORT - It means we have already taken this position at the Entry Price and expect the rate to go up/down to the Target level.
3. Stop-Loss/Profit Locked In - Sometimes we move the stop-loss level above (in case of LONG) or below (in case of SHORT) the Entry price. This means that we have locked in profit on this position.
4. Risk Factor - green "*" means high level of confidence (low level of uncertainty), grey "**" means medium level of confidence, red "***" means low level of confidence (high level of uncertainty)
5. Position Size (forex)- position size suggested for a USD 10,000 trading account in mini lots. You can calculate your position size as follows: (your account size in USD / USD 10,000) * (our position size). You should always round the result down. For example, if the result was 2.671, your position size should be 2 mini lots. This would be a great tool for your risk management!
Position size (precious metals) - position size suggested for a USD 10,000 trading account in units. You can calculate your position size as follows: (your account size in USD / USD 10,000) * (our position size).
6. Profit/Loss on recently closed position (forex) - is the amount of pips we have earned/lost on recently closed position. The amount in USD is calculated on the assumption of suggested position size for USD 10,000 trading account.
Profit/Loss on recently closed position (precious metals) - is profit/loss we have earned/lost per unit on recently closed position. The amount in USD is calculated on the assumption of suggested position size for USD 10,000 trading account.
