Technical Developments to Watch:
- EUR/USD at a 2-year low, bias bearish below 1.2500
- GBP/USD still grinding lower below bearish trend line and 20-day EMA
- USD/JPY rally has gone parabolic – chance of a pullback of 115.00 resistance
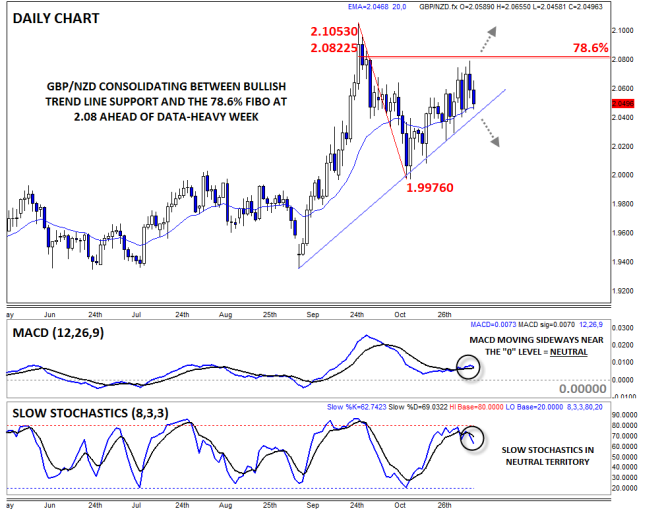
- GBP/NZD in play, consolidating between short-term bullish trend line support and Fib resistance
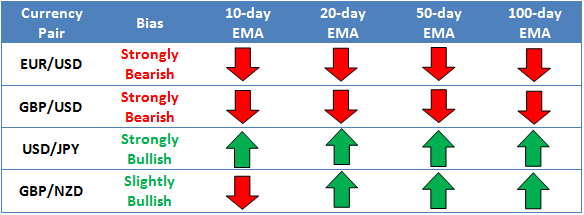
* Bias determined by the relationship between price and various EMAs. The following hierarchy determines bias (numbers represent how many EMAs the price closed the week above): 0 – Strongly Bearish, 1 – Slightly Bearish, 2 – Neutral, 3 – Slightly Bullish, 4 – Strongly Bullish.
** All data and comments in this report as of Friday’s European session close **
EUR/USD

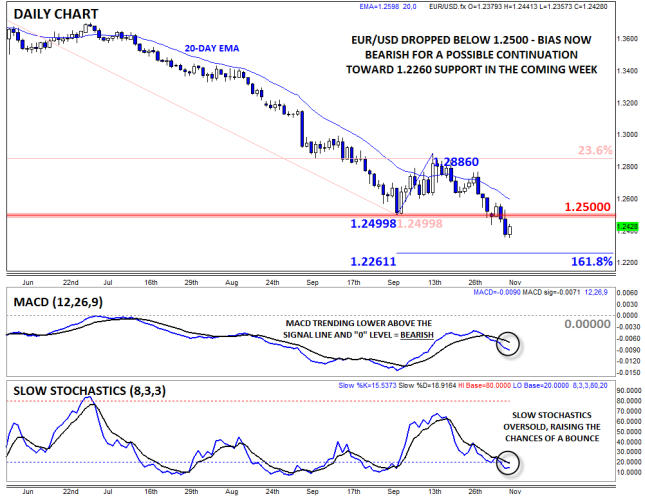
- EUR/USD dropped to a new 2-year low under 1.2400 on Thursday
- MACD bearish, though Slow Stochastics now in oversold territory
- Bias now firmly bearish below previous-support-turned-resistance at 1.2500
EURUSD dropped to a new two-year low on the back of dovish comments from ECB President Draghi on Thursday (for more on Draghi’s press conference, see Kathleen’s piece, “Has Draghi Won the Battle with the Bundesbank?”). At this point, the MACD indicator has rolled over and is now trading back below its signal line and the “0” level, though the Slow Stochastics have dipped into oversold territory, raising the probability of a bounce this week. Looking below, there are no major long-term support levels until all the way down near 1.2000, though short-term support may be found at the 161.8% Fibonacci extension of the early October bounce at 1.2260.

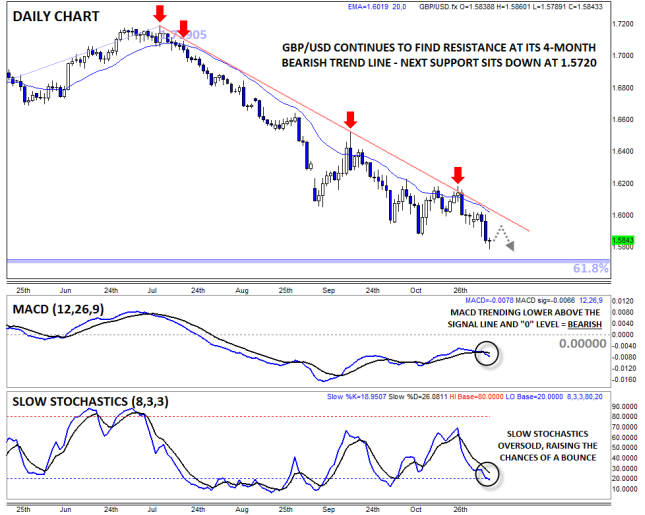
- GBP/USD followed EUR/USD to a new yearly low under 1.5900
- MACD turning back lower, though Slow Stochastics are flirting with oversold territory
- Bias remains bearish below bearish trend line resistance, next support sits at 1.5720
Like its mainland rival, GBPUSD also dropped sharply on Thursday. Taking a step back, the pair remains in a longer-term downtrend below its bearish trend line, and last week’s close at a new yearly low confirms the recent downtrend. The MACD indicator is showing signs of rolling over from below the “0” level, suggesting that bearish momentum may soon return, while the Slow Stochastics are flirting with oversold levels. For now, the dominant bearish trend will keep the bias in the pair to the downside as long as rates remain below trend line resistance and the 20-day EMA near 1.60.
USD/JPY

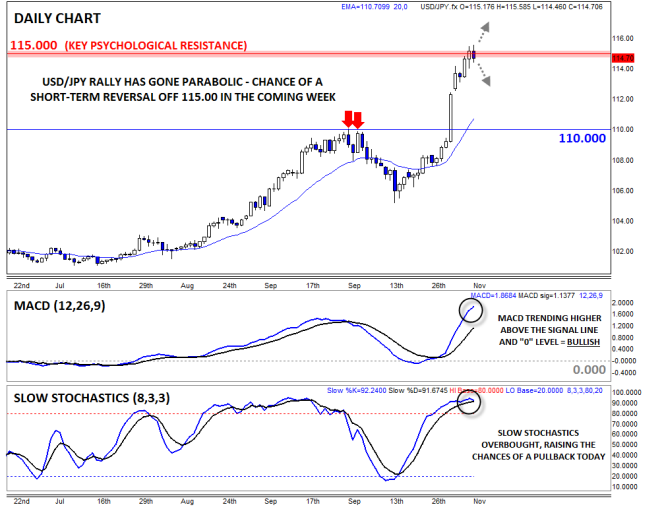
- USDJPY further extended its gains to trade above the 115 handle last week
- MACD remains strongly bullish, but Slow Stochastics remains in overbought territory
- Parabolic rallies often go further, faster than many expect, but are vulnerable to sharp pullbacks
USDJPY extended higher last week on the back of broad-based US dollar strength, though the pair’s rally has gone parabolic above the 115.00 level. As we’ve noted before, parabolic moves have a tendency to run further and faster than many traders expect, but they are notoriously vulnerable to violent corrections so bullish traders are encouraged to tread carefully this week. Not surprisingly, the MACD is strongly bullish, though the Slow Stochastics are showing signs of stalling in overbought territory. Any disappointing data out of the US (or strong data out of Japan) may serve as a catalyst for a pullback this week.

- GBP/NZD turned lower after testing Fib resistance near 2.08 last week
- MACD and Slow Stochastics show balanced, two-way trade
- Break of bullish trend line or last week’s high at 2.08 could signal next move.
GBPNZD is our currency pair in play due to a number of high-impact economic reports out of the UK, New Zealand, and China this week (see “Data Highlights” below for more). Looking to the chart, the pair turned lower last week after testing the 78.6% Fibonacci retracement at 2.08. Neither of the secondary indicators is providing a clear signal at this point, so traders should monitor the price action for a breakout of resistance at 2.08 or a drop through bullish trend line support near 2.04 to signal the next move in the pair.
Is the PBoC About to Engineer Another Fall in the Yuan?
At the beginning of this year, the People’s Bank of China (PBoC) engineered a decline in the renminbi, with the currency experiencing its biggest monthly drop on record against the US dollar in March. The move was designed to dispel the belief that the yuan was a one-way bet and to ease pressure on China’s export sector. At the time, the PBoC was attempting to withdraw liquidity from the market to rein in China’s massive shadow banking sector, but soft economic data raised concerns about the ability of the economy to cope with policy tightening and a forever strengthening exchange rate, thus the PBoC used its power over the exchange rate to weaken it in an attempt to ease pressure on the economy.
The comeback of the US dollar has increased the likelihood that the yuan may experience another sell-off. While the renminbi is down around 1% against the dollar this year as a result of the aforementioned sell-off, it has strengthened dramatically against the yen and the euro. This is largely because the Bank of Japan (BoJ) and the European Central Bank (ECB) are actively weakening their respective currencies through extreme policy easing, especially in the case of the BoJ.
Meanwhile, the Federal Reserve (Fed) in the US has been preparing to tighten monetary policy which has strengthened the US dollar. Yet, the recent bout of US dollar strength that has swept through the market hasn’t been felt against the yuan, despite the fact that Beijing is actively trying to promote growth through targeted policy loosening. The divergence of monetary policies between China and the US should arguably be having more of a positive impact on USD/CNY.
While we don’t expect any broad stimulus measures from Beijing due its drive towards more sustainable long-term growth, it has significant scope to ease policy further if needed to support the economy in the short-term. Recently, the PBoC injected liquidity into the nation’s biggest banks and small lenders, through direct injections and by lowering funding costs. Beijing has also eased restrictions that were aimed at limiting China’s property market. These targeted stimulus measures are less dangerous than using wide-reaching measures that could disrupt the PBoC’s attempts to implement important structural changes.
It’s easy to understand why the PBoC is concerned about China’s economic future. Last quarter, China’s economic growth decelerated to its lowest level in five years, dragged down by a softening property market. There are also indications that key parts of China’s economy are still struggling: domestic demand remains stagnant, China’s property bubble continues to deflate and the manufacturing and industrial sectors appear to be stressed.
Furthermore, China’s export sector isn’t as healthy as the official numbers suggest. The re-emergence of fake invoicing is distorting official trade data and may hide what could be a somewhat soft export market, as has been the case in recent times when over-invoicing has occurred. This definitely increases the attractiveness of weakening the yuan to help support trade exposed sectors.
So, with the threat of more policy easing and the possibility that the PBoC will act to weaken the yuan to support the export sector, the bias for USDCNY may be shifting once again to the topside, especially if the USD continues to strengthen against the majors. We are still some way off the pair’s historical low around 6.04, so there is still technically some room for further downside, but it may only be a matter of time before USDCNY makes a run higher given the concerns about China’s growth story and overwhelming USD strength in the market.
Look Ahead: Equities
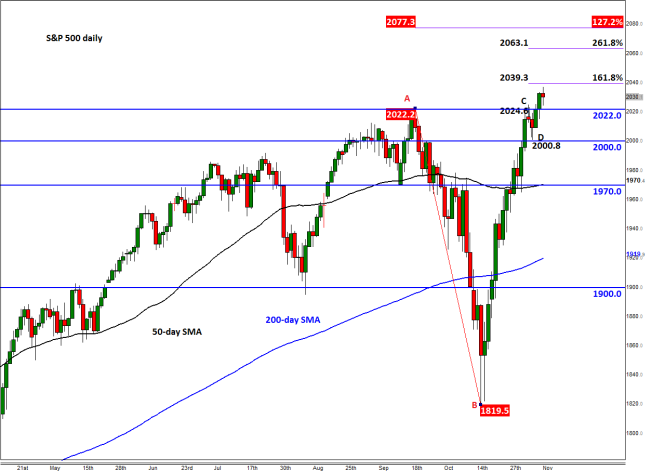
Despite Friday’s NFP-inspired losses, US stocks are still looking strong from both the fundamental and technical points of view. The latest US jobs report has shown that the labour market is continuing to improve at a solid pace, which bodes well for the economy as a whole. At the same time, weaker inflation and wage growth means the Fed will be in no rush to raise interest rates any time soon. And although the Fed may have ended QE, the Bank of Japan has increased its own asset purchases program and the European Central Bank is ready to do the same if deflationary pressures intensify. On top of the central bank support, we have so far had a very good earnings season in the US.
Meanwhile from a technical point of view, some of the major US indices have either reached or surpassed their previous record highs which clearly suggest the trend is bullish and the path of least resistance is to the upside. As the daily chart of the S&P shows, below, the index has staged a strong V-shaped recovery following the wobble at the end of September to mid-October. This type of a recovery usually suggests that there will be some follow-through momentum in the trend, which we have already witnessed in the past few days. With the index clearing the previous hurdle at 2022 and now trading at fresh unchartered territories, our technical view is that more gains will probably follow in the immediate future. On the chart, we have plotted two sets of Fibonacci extension levels: the first is derived from the September peak to the October low (i.e. the AB move) while the second is a much shorter-term swing from point C to D. These levels are some our near-term bullish targets. Meanwhile a potential close below the 2022 level would be a bearish development. In that scenario, a move down to 2000 and potentially even 1970, which is where the 50-day SMA meets old support, would become a possibility.
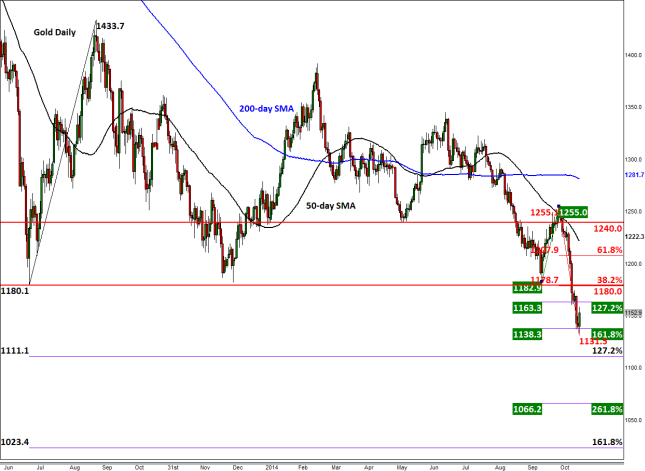
Gold was trading higher at the time of this writing on Friday after the US monthly jobs report showed fewer jobs were added in the economy than expected. This encouraged traders to take some profit on their long dollar positions, causing buck-denominated assets to rally. But we remain skeptical how high gold can go from here, for the jobs report wasn’t that bad. After all, the unemployment rate edged lower to 5.8% thanks to another 200-thousand-plus increase in non-farm employment. Ignoring today’s bounce, gold has dropped to a low so far of just under $1132 per troy ounce since reaching $1255 about three weeks ago. To put things into perspective, it has fallen almost 10% during this period, which is obviously a huge move. Most of the losses have been due to the US dollar, which has surged higher following last week’s hawkish FOMC statement and increasingly more dovish central banks elsewhere in G10. The Bank of Japan’s surprise decision to expand its asset purchases program last week was followed by a dovish European Central Bank meeting on Thursday. At the follow up monthly news conference, Mario Draghi said the ECB is prepared to act more aggressively to combat deflation threats if needed and that the policy makers were unanimous on this view. He also said that the ECB’s Governing Council expects the central bank’s balance sheet to reach the early 2012 levels, implying an increase of up to €1 trillion. The net effect of the BoJ and ECB announcements has been positive for not only the US dollar, but also the global equity markets. Thus this has weighed on safe-haven demand.
But given that gold has also fallen even in euro terms recently, the dollar alone cannot explain its weakness. It seems therefore that investors are not finding any value, at least at these levels, in tying up a significant portion of their capital in gold. What’s more, the physical demand for gold has also not been as strong as it had been in recent past. Price pressures remain weak across the globe so there is less need inflation hedging purposes at this moment. On top of this, the world’s top gold consumers – China and India – have been purchasing less gold. The Chinese are probably waiting for prices to fall further before increasing their purchases. Perhaps one piece of positive news for gold bugs is that prices are now close to the cost of production levels, therefore miners will be forced to halt production if they fall further and remain depressed. The potential reduction in supply growth could provide support to prices. But in the more near-term outlook, one other positive news is that the falling prices have given rise to bullion coin and bar sales, especially in North America. What’s more, the market sentiment is VERY bearish on precious metals and this is should be a warning sign for the bears that the trend may soon end.
Gold’s breakdown of the key $1180 support level last week has given rise to follow-up technical selling. The yellow metal has already reached both of our targets from last week: the 127.2% and 161.8% Fibonacci extension levels of the last rally that started at the beginning of October, at $1163 and $1138/9 respectively. Therefore Friday’s bounce was also driven by profit-taking which is part of the reason why we don’t think the rally will be sustained. Even if it does push further higher, it would do really well reach, let alone break, the $1180 level. For as long as it remains below this broken support level, our technical outlook on gold will remain bearish. Meanwhile the 127.2% extension of a separate move, the short-lived rally from the 2013 low comes is at the psychological $1111.1 level. This is our extended bearish target.
Monday, November 10, 2014
1:30 GMT Chinese Consumer Price Index (October)
China has another “data dump” this week with a whole host of important reports being released, and it doesn’t even start with this one. Trade Balance will be released on Saturday, but trade-wise, this is the first vital report for the Asian Giant. Europe, Japan, and even New Zealand have all taken measures to try to boost their inflation figures, and China is no exception as it has increased lending to major banks. Consensus calls for a repeat of last month’s 1.6% increase on YoY basis, but if it fails to reach that level, the AUD and NZD may feel the brunt of that blow.
Tuesday, November 11, 2014
0:30 GMT National Bank of Australia’s Business Confidence (October)
Businesses are typically a little ahead of the curve when it comes to the health of a nation. Policy makers are keenly aware of that fact and they glean insight into future consumer confidence from business confidence readings months before. Outside of an uptick in Employment and Retail Sales, Australian data hasn’t looked comforting of late as Trade Balance, Inflationary figures, and Housing numbers have been declining. Those last three factors could point to a drop in business confidence as well.
5:00 GMT Japanese Consumer Confidence Index (October)
Back on Halloween, the Bank of Japan dropped the monetary equivalent of a haymaker on the market by increasing their Quantitative and Qualitative Easing program up to 80 trillion yen per year and doubling the General Pension Investment Fund’s purchases of foreign securities up to 25% of their activities. The ultimate goal is to get the Japanese consumer away from saving and more toward consumption that theoretically would increase inflation and get them back to growth last seen in the 1980s. Considering this survey was conducted on October 15th, the Japanese consumer didn’t have that information, so watch out for a fourth straight miss of consensus on this release.
8:05 GMT Reserve Bank of New Zealand Financial Stability Report
The RBNZ dropped its hawkish lean last month which was widely anticipated, but still had a depressing effect on the NZD. All things equal, the downward reaction for the currency is exactly what the bank was hoping for as it continues to proclaim the currency overvalued. Along with the Financial Stability Report, Governor Graeme Wheeler will be providing a speech to expound on the report. The report may not provide much new insight since the RBNZ meeting wasn’t that long ago, but could give a stronger argument for dropping the hawkish bias which could send the NZD even lower still.
Wednesday, November 12, 2014
8:00 GMT Federal Reserve Bank of Philadelphia President Charles Plosser Speech
Following the release of the Non-Farm Payroll and the Unemployment Rate this past week, Plosser (a current voter on the board) likely won’t change his affiliation as a known hawk at the Fed. The more likely scenario is that Plosser gives the reasons why the Fed should increase interest rates sooner rather than later. Even though NFP fell short of expectations, the 214k result was still above the 200k threshold, unemployment fell, participation increased, and previous figures were revised up as well. Plosser’s hawkishness may encourage USD bulls to look for even further gains, but if he tempers excitement on the grounds of disappointing inflation, the USD may be in for a correction.
9:30 GMT UK Claimant Count Change and Unemployment Rate
The UK has performed admirably the past few months despite its larger and highly influential cousin, the Eurozone, struggling mightily on a variety of fronts. Last month saw a potential pandering to EZ struggles with the Claimant Count failing to meet previous levels as well as expectations. Are the issues finally crossing the English Channel? Another miss on the employment front could be a big red blinking light that the race to be the first of the major central banks to raise interest rates may not be in the Bank of England’s favor and could knock the GBP down further.
10:00 GMT Eurozone Industrial Production
This past week, European Central Bank President Mario Draghi was rumored to be at odds with his fellow committee members, then shot those rumors to pieces at the ECB press conference by stating that the ECB was unanimous in their decision to “soon start to purchase asset-backed securities.” So the ECB is doing Quantitative Easing without outright calling it that, but that’s beside the point. Here’s the important part: the Eurozone is struggling, and the ECB is willing to do something about it. One potential way to get back to good would be to get a positive IP report that could boost the self-esteem of the beleaguered currency and provide a start to a small recovery. If not, the bottom of the EUR may not be in sight just yet.
10:30 GMT Bank of England Quarterly Inflation Report and Governor Mark Carney Speech
The last QIR was a defining moment for the GBP as Carney essentially told the world to not get ahead of themselves in the thought that the BoE was going to put its head down and plow forward to interest rate hikes by saying that the “Monetary Policy Committee has no preset course.” He then went on discussing the challenges that they face including geopolitical risks, structural adjustment in the Eurozone, tightening financial conditions worldwide, and a lack of growth in productivity and real incomes in the UK. Since Carney poured water on the hot stove last time around to temper expectations, he may give more of a “wait and see” type of report this time around, mainly stemming from concerns surrounding the Eurozone. The last bastion of investors who were expecting the BoE to be the first to raise interest rates may give up hope if such a report is given, and the GBP may suffer for it.
Thursday, November 13, 2014
No major data releases.
Friday, November 14, 2014
10:00 GMT Eurozone Preliminary Gross Domestic Product
As discussed in the IP section, the ECB is just beginning to flex their monetary muscle in helping the EZ get its footing; and that isn’t soon enough for this GDP report. Regardless, consensus is calling for a 0.1% increase QoQ, but has disappointed each of the previous two quarters. Even if this report falls in to negative territory, it may not be much of a surprise and likely wouldn’t be too negative on the EUR. The more market moving result could be a better than anticipated number which could signal that the EZ could recover much more quickly than most assume currently.
13:30 GMT Canadian Manufacturing Sales (September)
This report is a little stale considering it comes from the month of September, but if we were to follow other Canadian reports from that month, like Employment, there could be a positive surprise in store. Employment rose much more strongly than assumed for the month which may have been a result of better sales on the manufacturing front of the economy. Consensus is calling for a strong rebound of 1.3% after the previous month’s 3.3% drop. If it were to be achieved, the CAD may find even more strength following another strong employment report this past week.
13:30 GMT US Retail Sales (October)
We’ve all heard about the strength in the US economy and the likelihood that the Fed would be the first of the major central banks to raise interest rates, but that optimism hasn’t spilled in to the retail sector quite yet. Retail Sales have been the one black mark on the US recovery due to its inability to achieve expectations five out the last six months. Granted, consumers are a little weary still after the Great Financial Crisis turned us all in to economic pessimists, but considering the increases in employment and the confidence of the Fed to taper away QE, we may still be in the initial stages of a major US recovery; and it’s about time for the US consumer to join the party. Watch for a positive surprise here which would only serve to further support positive USD movements.
14:55 GMT Preliminary UM/Reuters US Consumer Sentiment Index (November)
While Retail Sales have struggled to achieve meaningful growth, consumer confidence has not had as much trouble. Last month’s 86.4 result (revised up to 86.9) was the highest UM/Reuters figure since mid-2007, and consensus is looking for something even higher this month. And why wouldn’t they? As previously mentioned ad nausea, US figures have been improving, and they don’t appear to be waning, which is a good indication that consumers are starting to become optimists. Even if this number doesn’t achieve consensus, it may be shrugged off as long as it remains above 85.
