EUR/USD - European Session
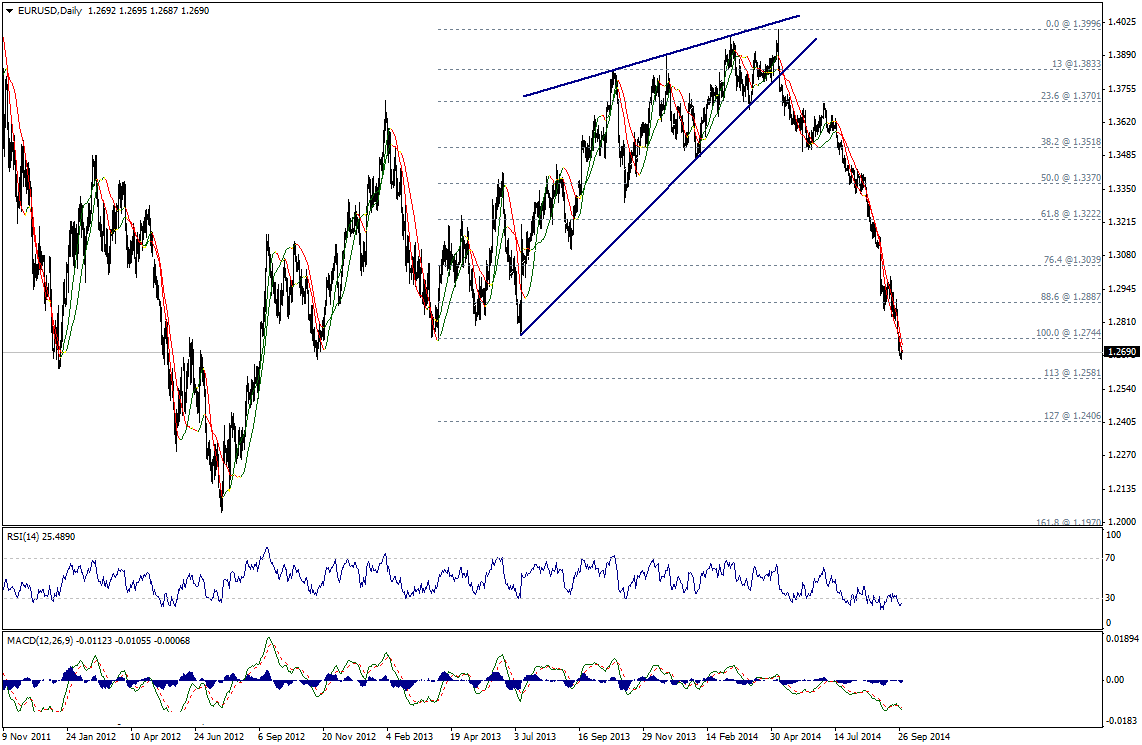
The pair witnessed volatility yesterday and an attempt to move to the upside, but this attempt remained limited below the previous bottom 1.2744. Trading below 1.2744 strengthens the negative possibility targeting 113% correction at 1.2580. Only a break above 1.2890 brings back positivity, but intraday today, we depend on stabilizing below 1.2785 to keep the negative expectation.
We notice oversold signals on technical indicators, meanwhile, Linear Regression Indicators are still very negative supporting the negative expectations as long as the pair stabilized below 1.2885 today.

GBP/USD - European Session
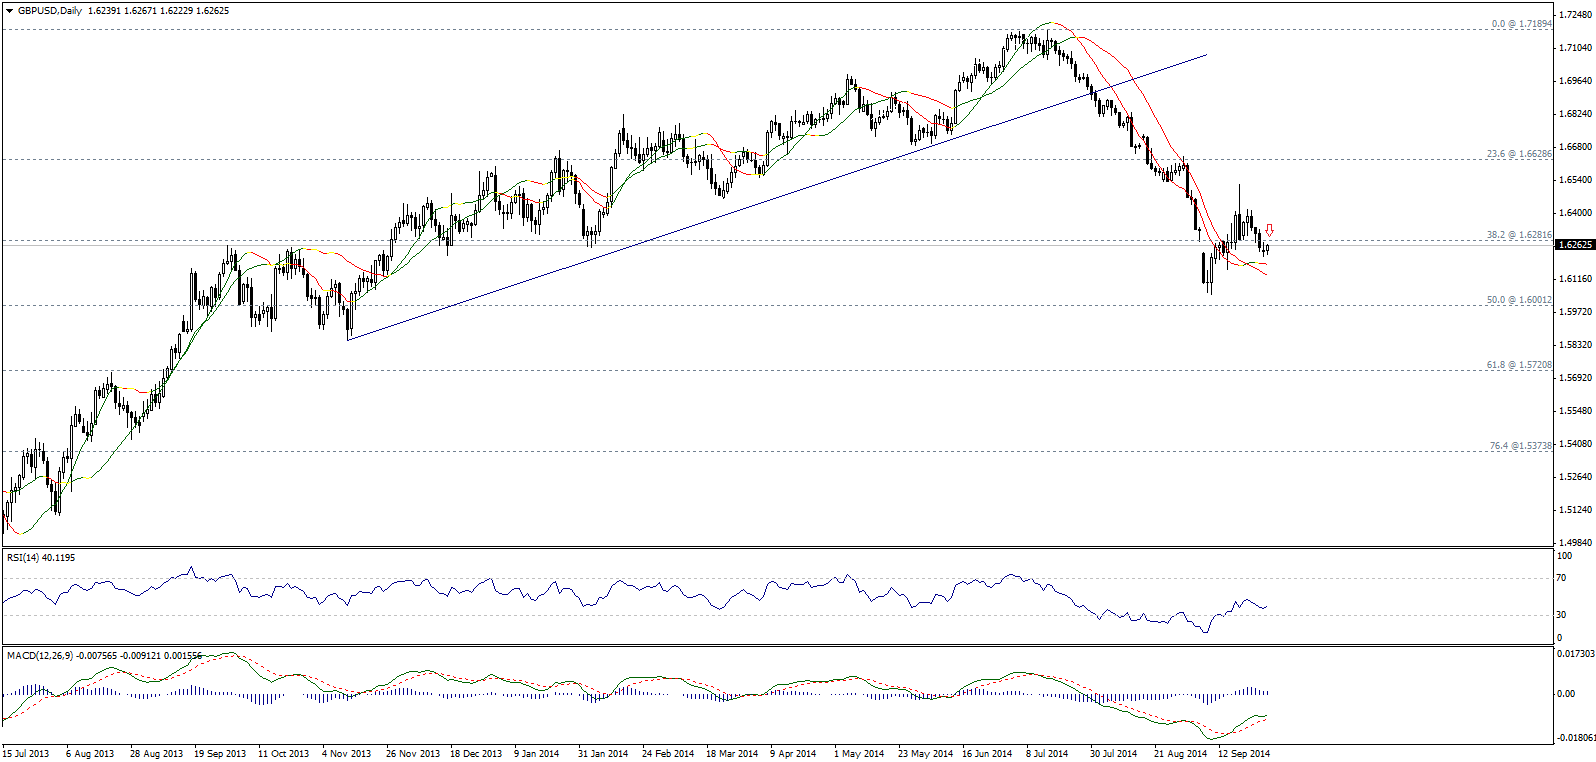
GBP/USD pair is almost retesting 1.6285 levels that represent a resistance keeping the bearish expectations valid, and its next main target resides at 1.6000 as we still favor the bearish bias in the upcoming period.
We refer to the continuing pressure on the British Prime Minister David Cameron's governement that could negatively effect and weaken the pair.

USD/JPY - Technical Report
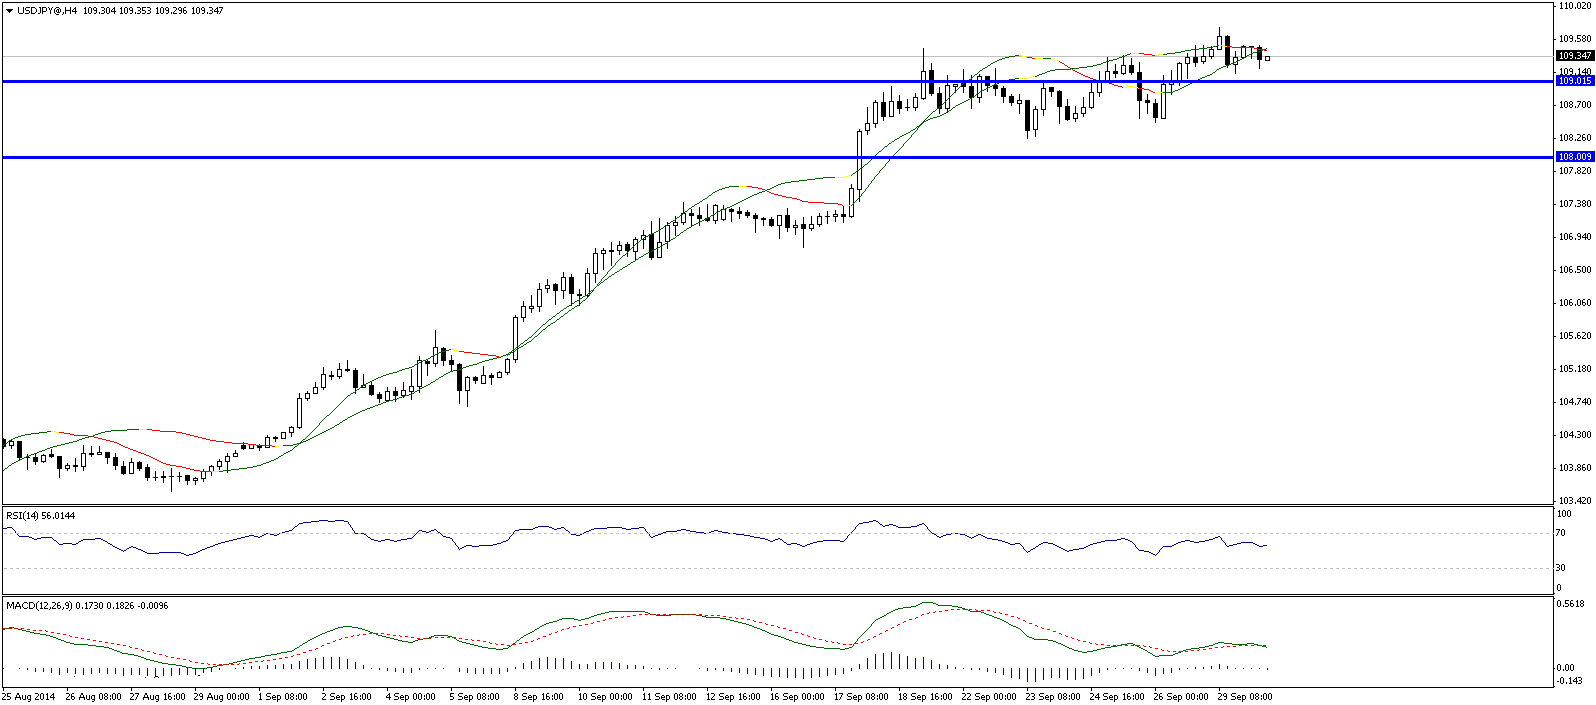
The pair is still stable above 109.00 levels keeping the bullish expectations valid targeting 110.00, while a break below 108.30 fails the suggested expectations.

USD/CHF - Technical Report
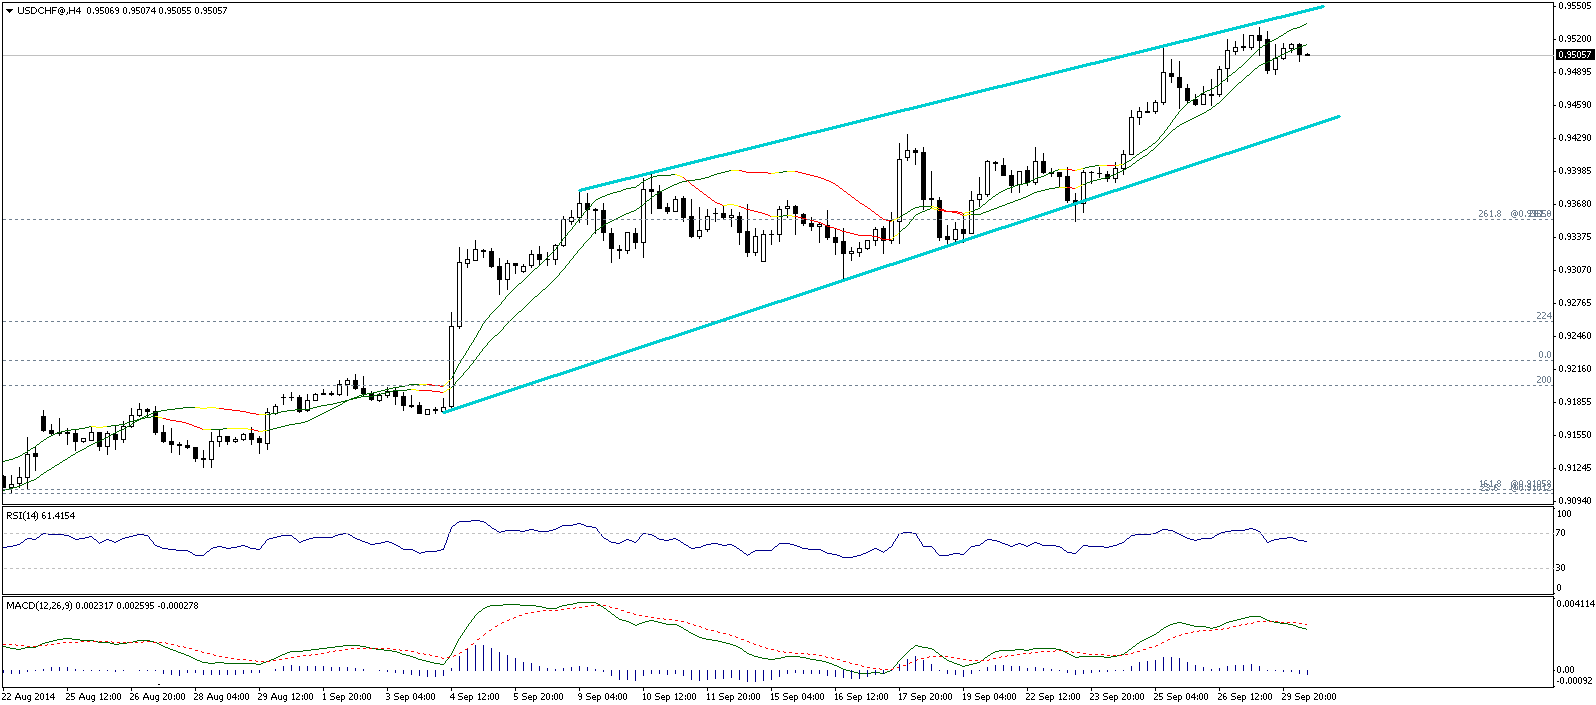
The pair dropped slightly and remained above 0.9480 keeping the upside move valid targeting 0.9550 and 0.9600, while a break below 0.9455 fails the suggested expectations.

USD/CAD - Technical Report
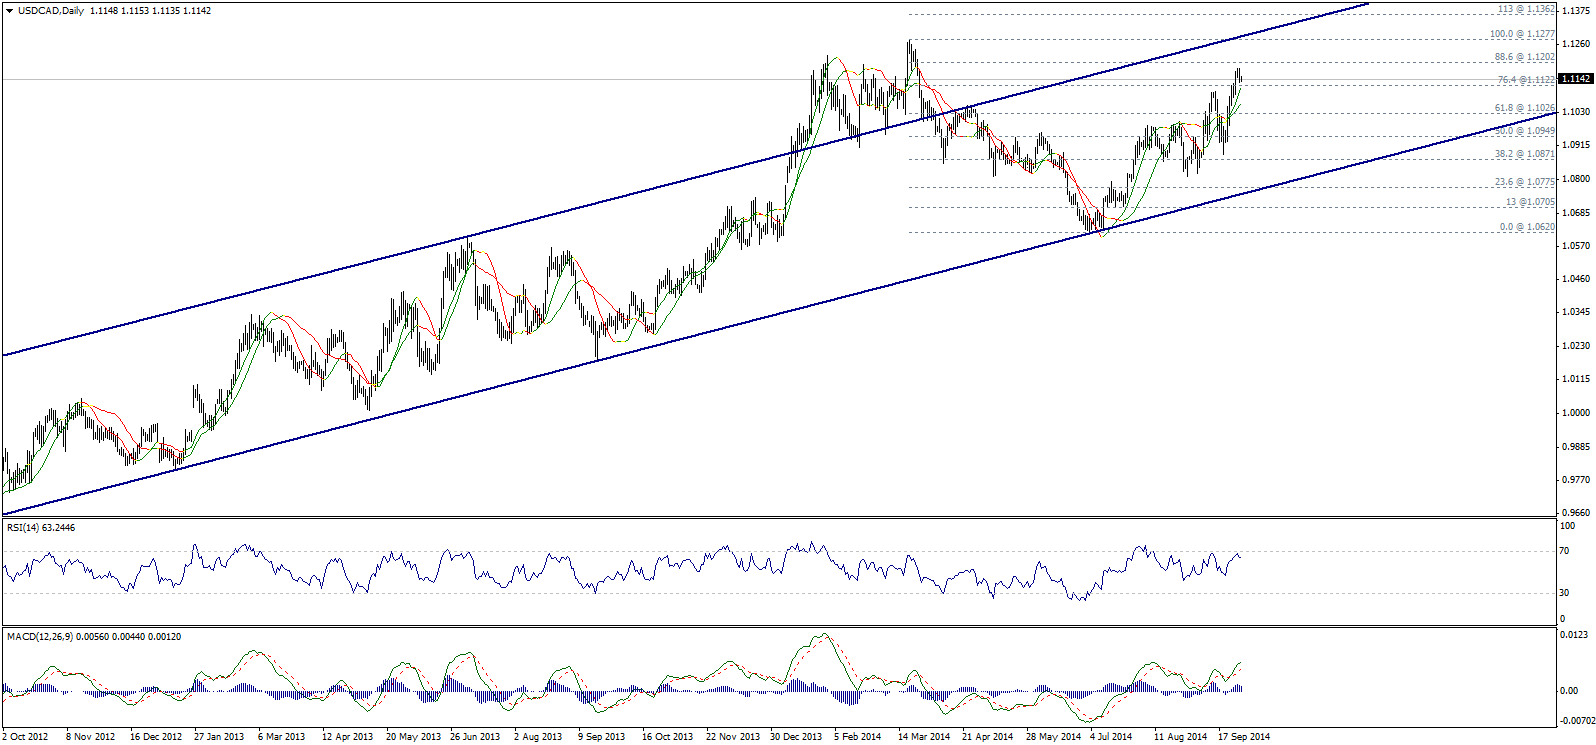
We noticed some bearish correction yesterday, but trading remained limited above 76.4% correction at 1.1120. Trading above the mentioned Fibonacci level 76.4% keeps the bullish possibility valid. Linear Regression Indicators are positive and MACD still tends to be positive, but RSI is showing weakness wich will be ignored as long as trading remains above 1.1075 intraday today and above 1.1025 for the short-term upcoming period.
From the upside, a break above 1.1205 indicates forming a new bullish wave supported by Linear Regression Indicators 34 and 55 from the downside, which is carrying the pair during its trip to the upside.

AUD/USD - European Session
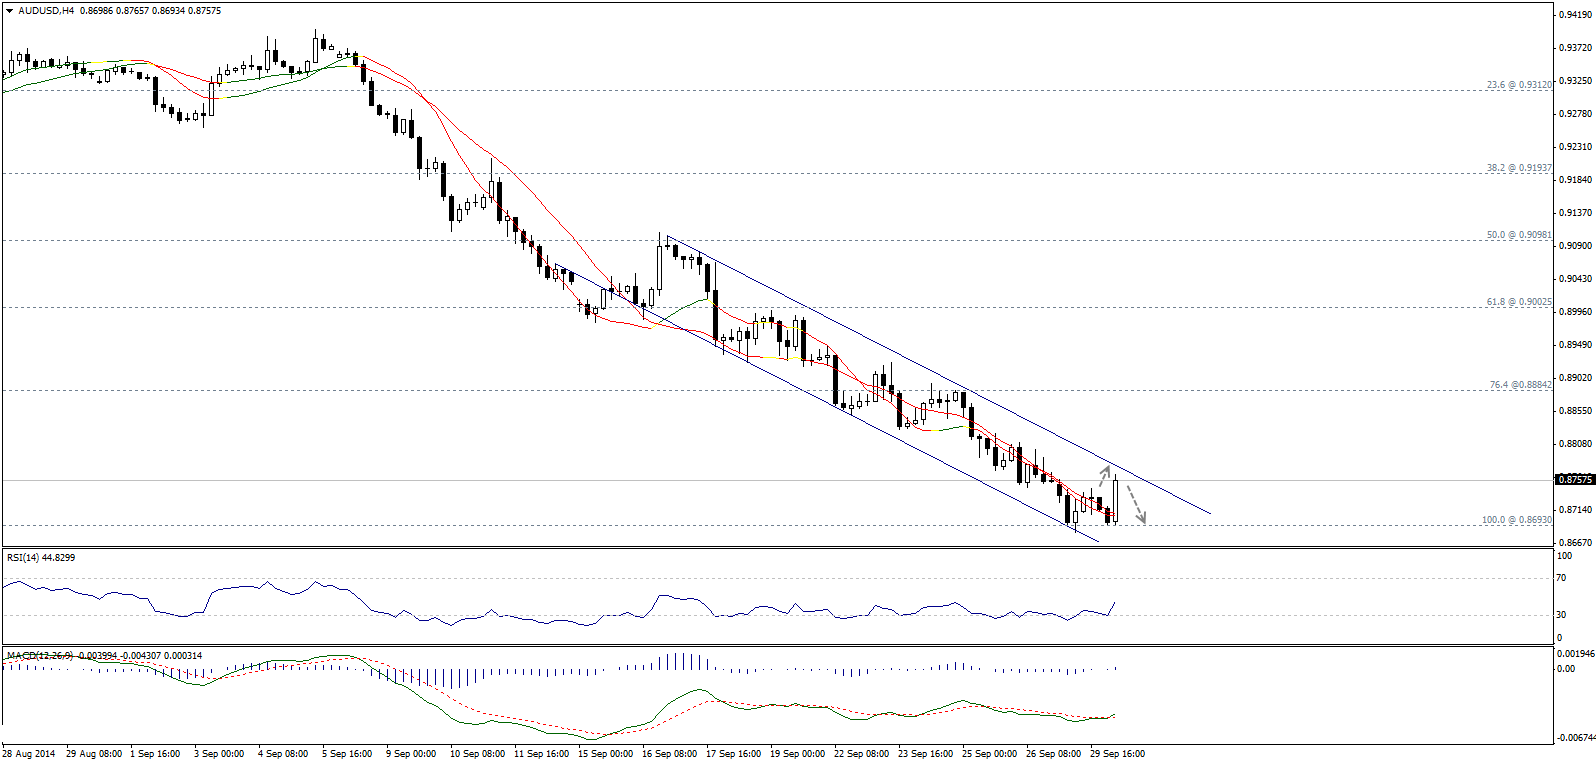
The pair reached the resistance of the descending channel showing above, as we wait for the pair to rebound to the downside based on rules of trading within price channels, as the targets start by breaking 0.8690 to ease the way towards 0.8585. levels.
Therefore, the downside move remains favored till now supported by catalysts supporting the strength of the pair.

NZD/USD - Technical Report
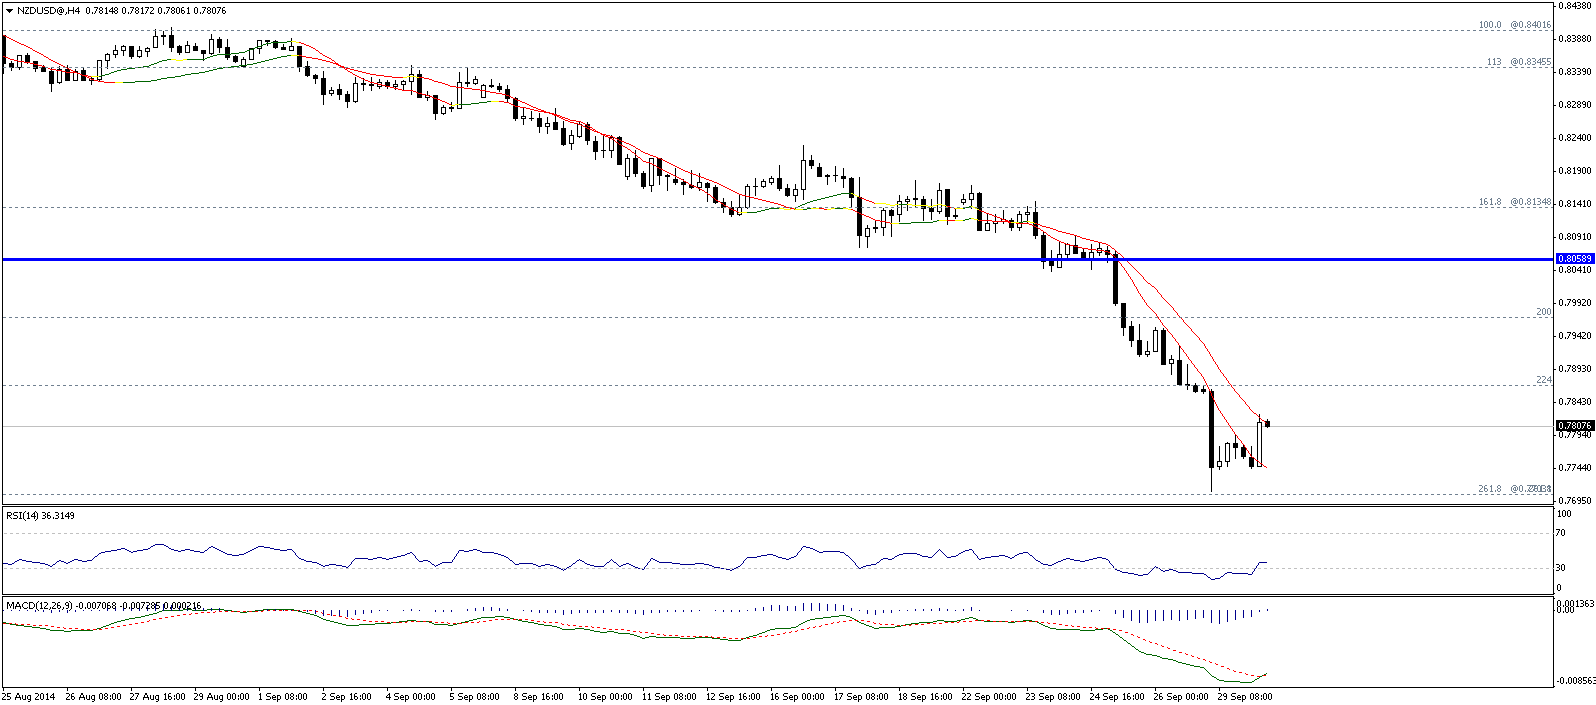
The pair inched higher and is trading around 0.7800, despite that, we keep our positive expectations while still trading below 0.7860, as we need to trade again below 0.7800 to confirm the downside move targeting 0.7760 and 0.7730, while a break above 0.7860 fails the suggested expectations and activates the bullish expectations.

