Get 40% Off
🚨 Volatile Markets? Find Hidden Gems for Serious OutperformanceFind Stocks Now

EUR/USD Wave Analysis: Local Bearish Outlook

Published 09/15/2016, 07:59 AM
Updated 07/09/2023, 06:32 AM

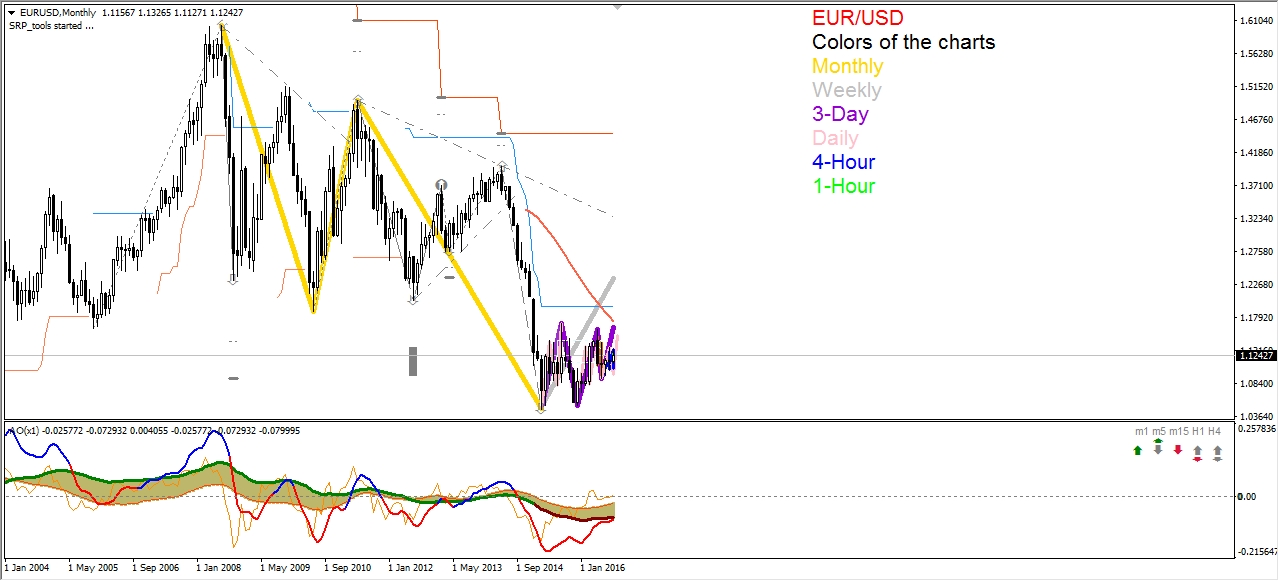
Monthly Chart
The big down trend of EUR/USD started on July 2008 and formed a 3-wave structure plotted with yellow lines on the chart below. However, for the 2nd year already we have been witnessing a sideways move with a bullish shift that could be considered as a correction subwave within the 3rd bearish impulse wave on a monthly chart.
EUR/USD Monthly Chart

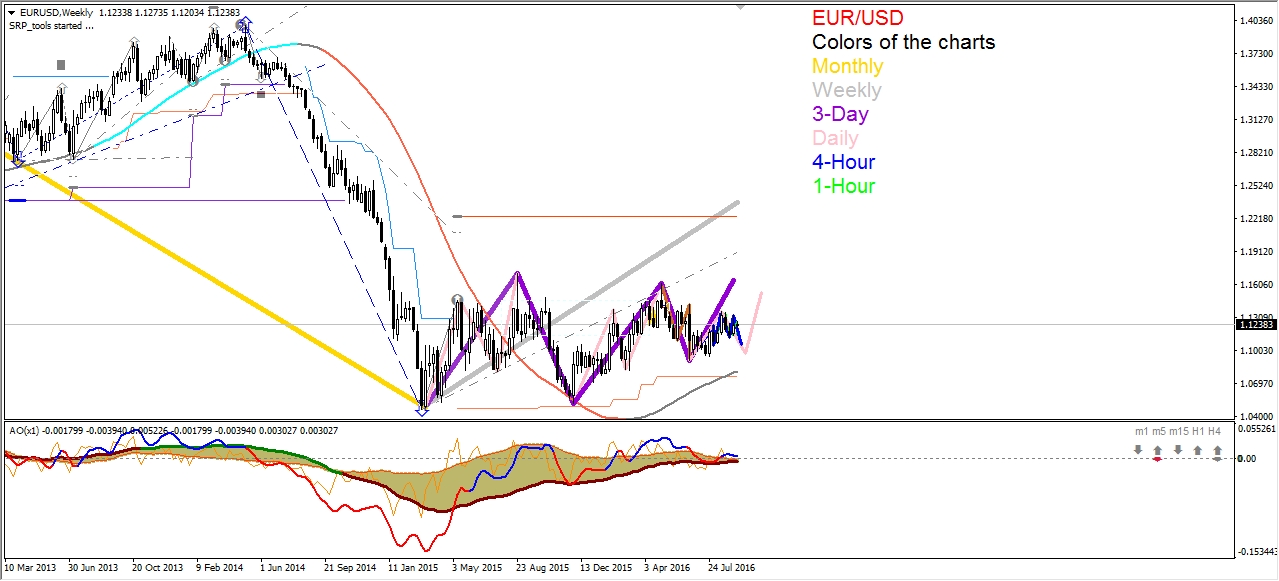
Weekly Chart
This correction on a smaller weekly time frame could be estimated as the 1st impulse bullish wave in progress (marked by a grey line). Since a weekly chart does not provide us too much data on the current situation, we have to switch to a bit smaller time frame to study its enclosure.
EUR/USD Weekly Chart

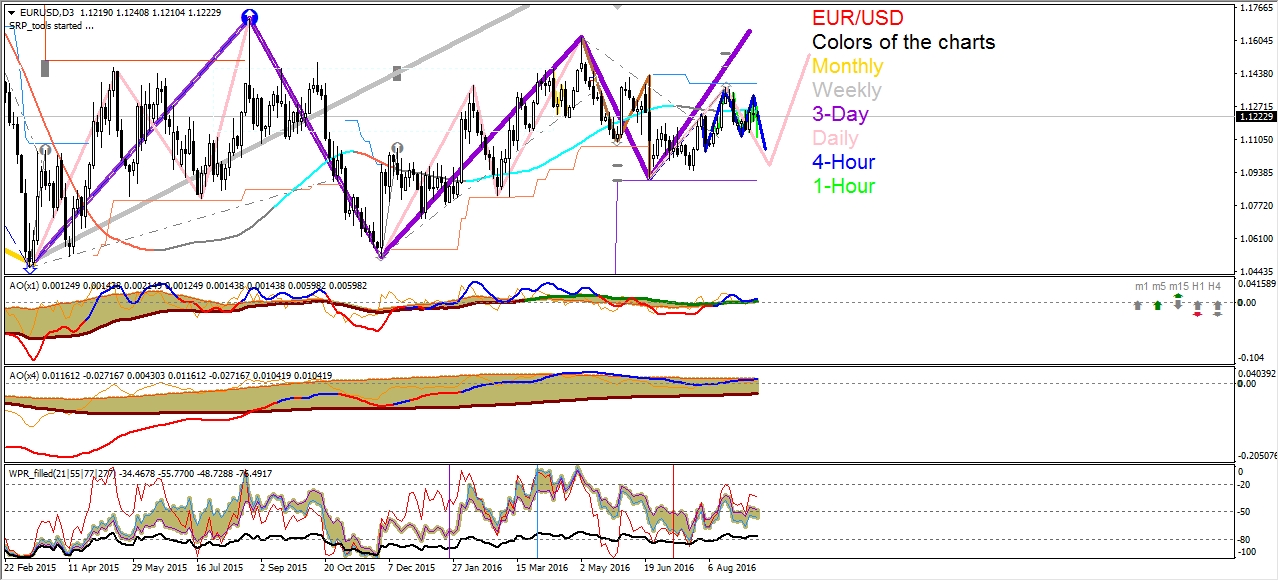
3-Day Chart
EUR on a 3-day time frame has built a flat 5-wave structure and is constructing the 5th bullish wave now.
EUR/USD 3 Day Chart

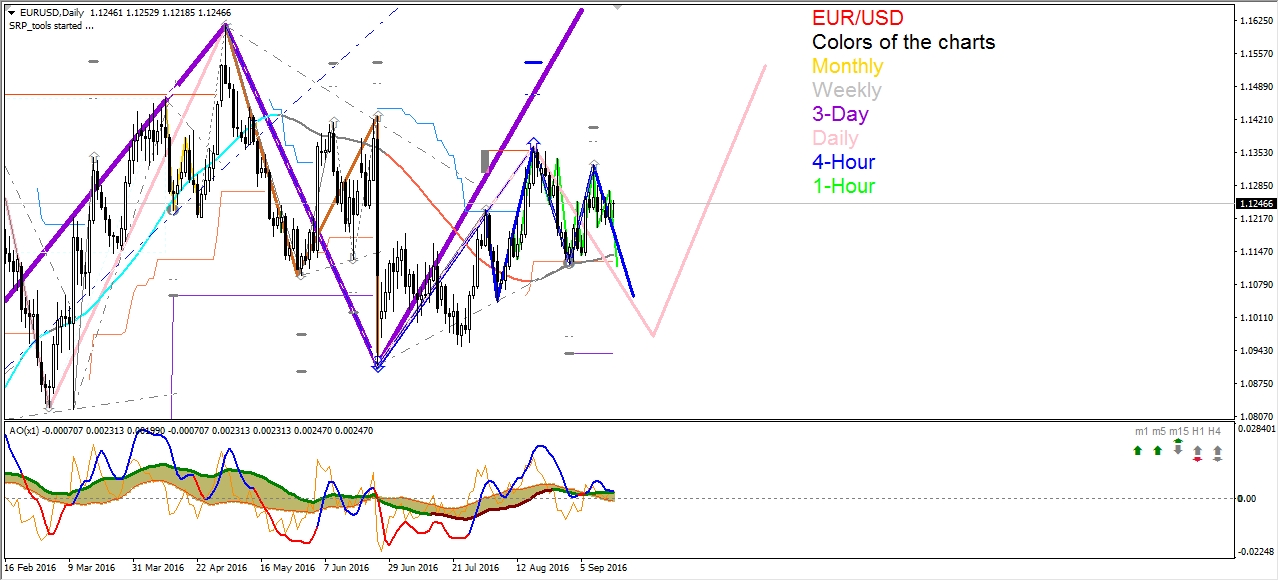
Daily Chart
A daily time frame could be used to have a closer look at the enclosed subwaves of the 5th wave. EUR has completed the 1st impulse wave up and is making the 2nd bearish correction wave now to be followed by the 3rd impulse up.
EUR/USD Daily Chart

4-Hour Chart
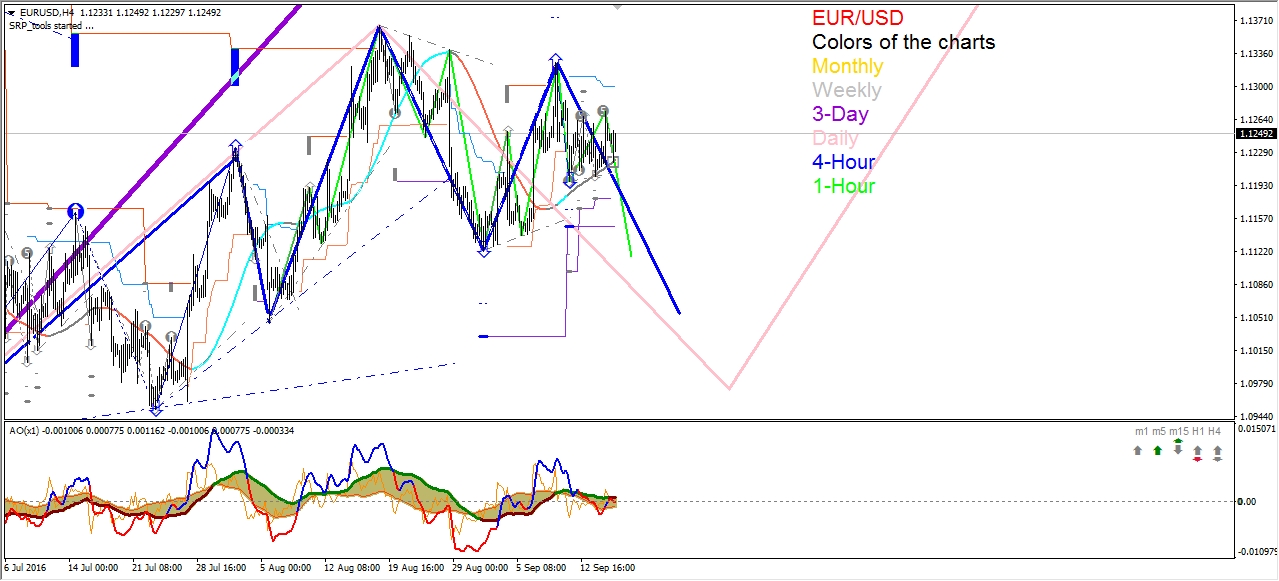
Within the 2nd correction wave down of the daily time frame we could see an enclosed 3-wave structure on a smaller 4-hour chart with the 1st impulse down and the 2nd correction up completed (these waves are drawn with blue lines). We expect the 3rd bearish impulse on a 4-hour time frame.
EUR/USD 4 Hour Chart

1-Hour Chart
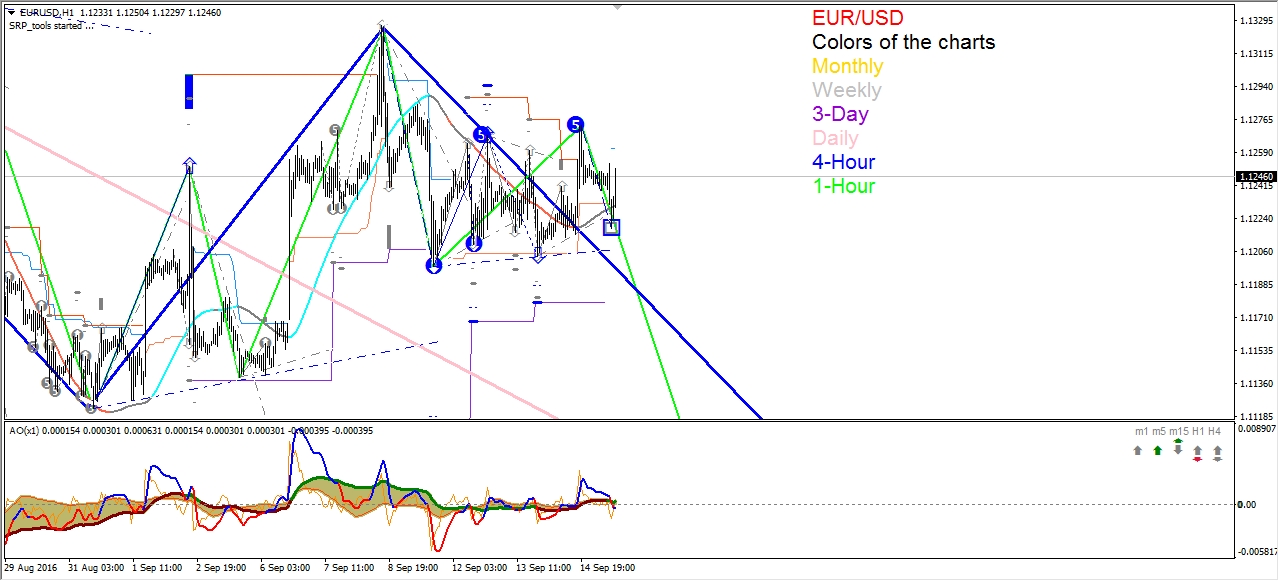
If the 3rd wave down on a 4-hour chart has really started already, we could see its inner structure on a smaller 1-hour time frame. Its waves are shown with lime lines. After the 1st impulse down and the adequate 2nd bullish correction the 3rd bearish impulse to be followed.
EUR/USD 1 Hour Chart

3rd party Ad. Not an offer or recommendation by Investing.com. See disclosure here or remove ads .

Original post

Latest comments

Risk Disclosure: Trading in financial instruments and/or cryptocurrencies involves high risks including the risk of losing some, or all, of your investment amount, and may not be suitable for all investors. Prices of cryptocurrencies are extremely volatile and may be affected by external factors such as financial, regulatory or political events. Trading on margin increases the financial risks.
Before deciding to trade in financial instrument or cryptocurrencies you should be fully informed of the risks and costs associated with trading the financial markets, carefully consider your investment objectives, level of experience, and risk appetite, and seek professional advice where needed.
Fusion Media would like to remind you that the data contained in this website is not necessarily real-time nor accurate. The data and prices on the website are not necessarily provided by any market or exchange, but may be provided by market makers, and so prices may not be accurate and may differ from the actual price at any given market, meaning prices are indicative and not appropriate for trading purposes. Fusion Media and any provider of the data contained in this website will not accept liability for any loss or damage as a result of your trading, or your reliance on the information contained within this website.
It is prohibited to use, store, reproduce, display, modify, transmit or distribute the data contained in this website without the explicit prior written permission of Fusion Media and/or the data provider. All intellectual property rights are reserved by the providers and/or the exchange providing the data contained in this website.
Fusion Media may be compensated by the advertisers that appear on the website, based on your interaction with the advertisements or advertisers.
© 2007-2024 - Fusion Media Limited. All Rights Reserved.