EUR/USD
Near-term tone is positively aligned and sees the upside targets at 1.3000/1.3040 zone, round figure / 50%/61.8% retracement of 1.3153/1.2858 downleg in focus, as the price ticked higher, approaching initial 1.30 barrier. These levels are seen as turning points and sustained break would signal stronger recovery action in the near-term. Broken-bull-trendline off Nov 2012 low, now offer support and would keep afloat bulls, developing on lower timeframes charts. On the other side, overall picture remains negative, with downside risk towards 1.2786/50 targets, expected to remain in play, as long as 1.3153 lower top and breakpoint stays intact.
Res: 1.2977; 1.2993; 1.3000; 1.3040
Sup: 1.2930; 1.2900; 1.2882; 1.2858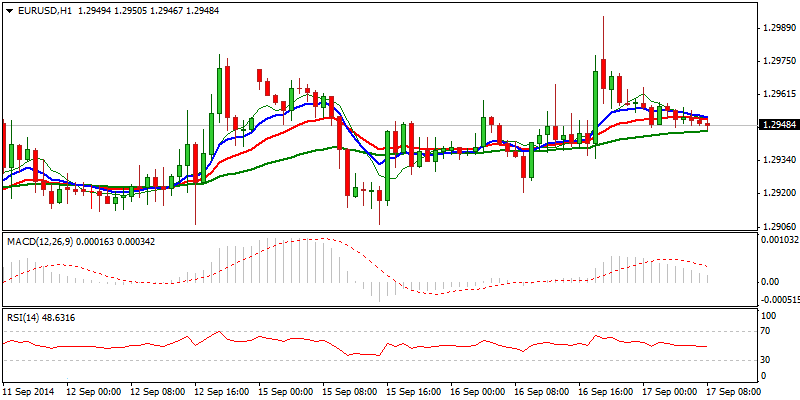
EUR/JPY
The pair remains in consolidative trade under fresh high at 139.16, with overall bulls firmly in play and seeing scope for eventual clearance of pivotal 139.26, peak of 03 July. Completion of 139.26/135.71 bear-phase, is seen as a trigger for further recovery towards psychological 140 barrier, lower top of 09 June / near 200SMA. Corrective action was so far held at 138.45, with further easing to be ideally contained at 138.27/00 zone, previous peak of 03 Sep / round-figure support / 4-hour 55SMA.
Res: 139.16; 139.26; 139.51; 140.00
Sup: 138.45; 138.27; 138.00; 137.88 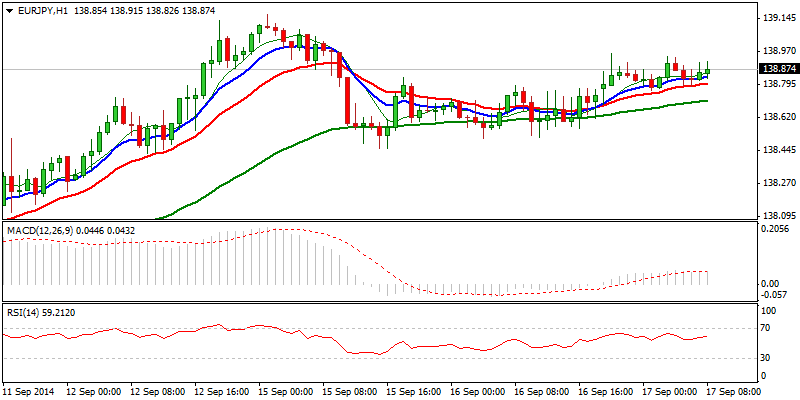
GBP/USD
Cable regained strength in near-term action off 1.6159, yesterday’s correction low and cracked important 1.63 barrier. Bulls are coming in play on lower timeframes, which supports attempts through 1.63 hurdle, clear break of which is required to resume recovery rally off 1.6050, low of 10 Sep. However extension above 1.6340 is needed to fill the gap of 08 Sep and confirm recovery action, which will also neutralize bearish engulfing pattern, developing on the daily chart, which requires extension below yesterday’s low at 1.6159, to confirm reversal.
Res: 1.6309; 1.6338; 1.6416; 1.6463
Sup: 1.6247; 1.6210; 1.6184; 1.6159 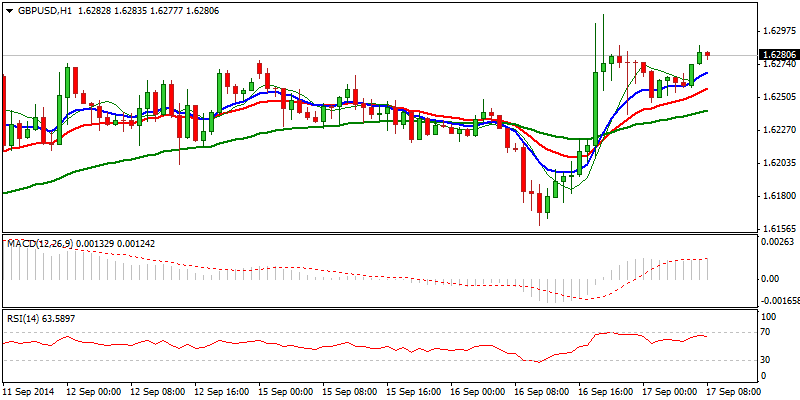
USD/JPY
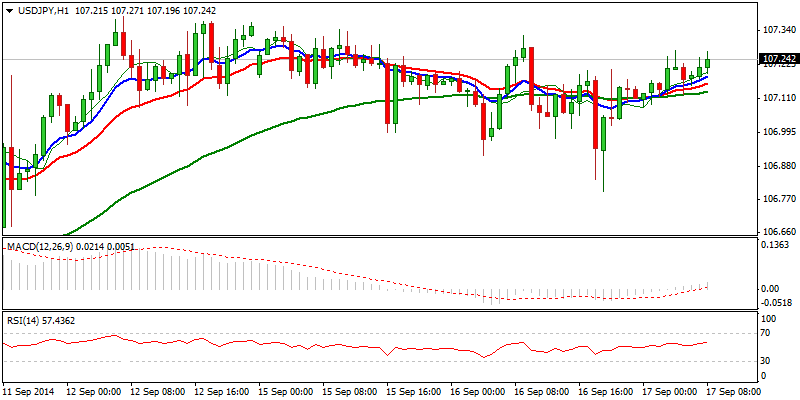
The pair remains positive and regains levels above 107, with near-term price action continuing to move in consolidative mode, off fresh high at 107.38. This keeps immediate focus at the initial target at 107.50, to signal an end of consolidative phase and open 108.28, Fibonacci 161.8% projection of the upleg from 100.81. Extended dips, are expected to hold above 106.50/35 support zone, to keep bulls intact, as the pair is looking for extension towards 108.110 zone in the near term.
Res: 107.38; 107.50; 108.00; 108.28
Sup: 106.79; 106.50; 106.35; 106.00
AUD/USD
The pair holds overall negative tone, with near-term corrective action off fresh low at 0.8982, accelerating after clearance of initial 0.9050 barrier. Hourly studies improved on a probe above 0.91 barrier and see room for further recovery action, as the rally cracked pivotal 0.9100/26, 50%/61.8% retracement of 0.9216/0.8982 zone. Sustained break above the latter to confirm hourly double-bottom formation, revive bulls on still weak 4-hour studies and spark further recovery, which would expose 200SMA at 0.9181. Alternatively, false break through 0.91 barrier, would re-focus 0.9050, now acting as support and risk return to the lows below 0.90 handle.
Res: 0.9110; 0.9126; 0.9160; 0.9181
Sup: 0.9059; 0.9050; 0.9000; 0.8980 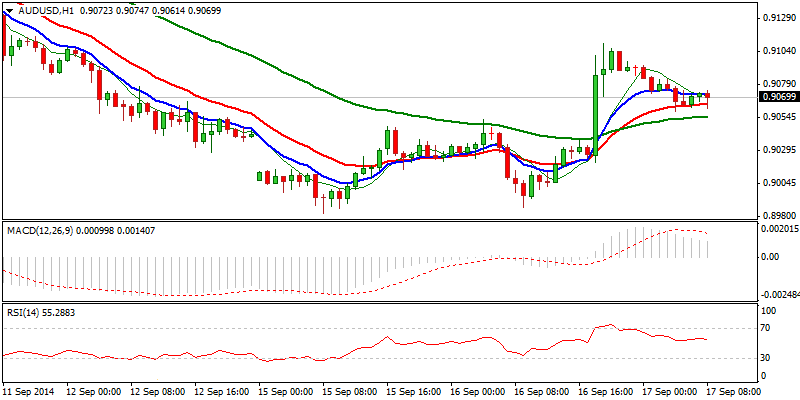
AUD/NZD
The pair bounced close to 1.11 barrier, after near-term bears lost traction on approach to psychological 1.10 support. Fresh upside action was signaled by yesterday’s Outside Day pattern, which sees potential for further upside, on clear break above 1.11 barrier, as daily chart picture is still positive. Hourly studies turned positive, however, 4- hour structure is weak and would risk lower top formation, on a failure to clear 1.11 level.
Res: 1.1100; 1.1121; 1.1145; 1.1175
Sup: 1.1070; 1.1049; 1.1016; 1.1000 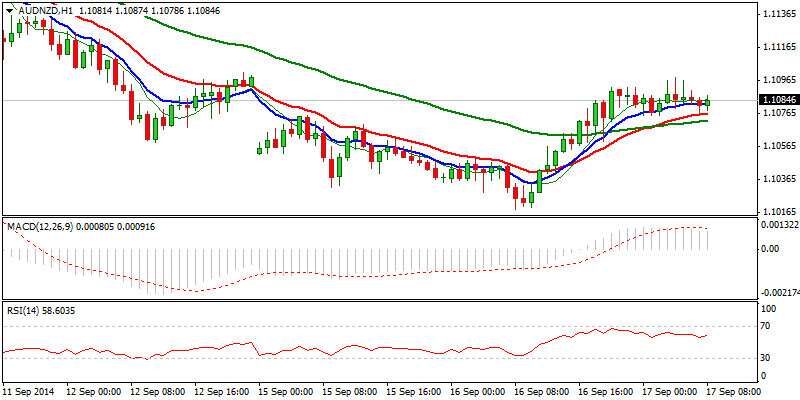
XAU/USD
Spot Gold trades in extended corrective move off fresh low at 1225, which dented initial 1240 barrier. Positively aligned hourly studies may extend corrective action towards 1248, 50% of 1271/1225 downleg, reinforced by 4-hour 55SMA. However, overall negative structure does not see much of the upside potential for now, unless the rally clears 1257 lower top and Fibonacci 61.8% of 1271/1225 descend.
Res: 1242; 1248; 1251; 1257
Sup: 1231; 1225; 1215; 1200 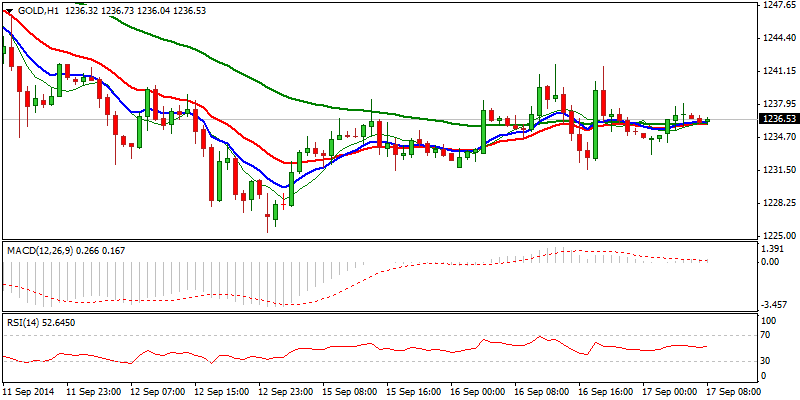
- English (UK)
- English (India)
- English (Canada)
- English (Australia)
- English (South Africa)
- English (Philippines)
- English (Nigeria)
- Deutsch
- Español (España)
- Español (México)
- Français
- Italiano
- Nederlands
- Português (Portugal)
- Polski
- Português (Brasil)
- Русский
- Türkçe
- العربية
- Ελληνικά
- Svenska
- Suomi
- עברית
- 日本語
- 한국어
- 简体中文
- 繁體中文
- Bahasa Indonesia
- Bahasa Melayu
- ไทย
- Tiếng Việt
- हिंदी
EUR/USD Near-Term Tone Positively Aligned; AUD/USD Holds Negative Tone
Published 09/17/2014, 03:23 AM
Updated 02/21/2017, 08:25 AM
EUR/USD Near-Term Tone Positively Aligned; AUD/USD Holds Negative Tone

FinFX
3rd party Ad. Not an offer or recommendation by Investing.com. See disclosure here or
remove ads
.
Latest comments
Install Our App
Risk Disclosure: Trading in financial instruments and/or cryptocurrencies involves high risks including the risk of losing some, or all, of your investment amount, and may not be suitable for all investors. Prices of cryptocurrencies are extremely volatile and may be affected by external factors such as financial, regulatory or political events. Trading on margin increases the financial risks.
Before deciding to trade in financial instrument or cryptocurrencies you should be fully informed of the risks and costs associated with trading the financial markets, carefully consider your investment objectives, level of experience, and risk appetite, and seek professional advice where needed.
Fusion Media would like to remind you that the data contained in this website is not necessarily real-time nor accurate. The data and prices on the website are not necessarily provided by any market or exchange, but may be provided by market makers, and so prices may not be accurate and may differ from the actual price at any given market, meaning prices are indicative and not appropriate for trading purposes. Fusion Media and any provider of the data contained in this website will not accept liability for any loss or damage as a result of your trading, or your reliance on the information contained within this website.
It is prohibited to use, store, reproduce, display, modify, transmit or distribute the data contained in this website without the explicit prior written permission of Fusion Media and/or the data provider. All intellectual property rights are reserved by the providers and/or the exchange providing the data contained in this website.
Fusion Media may be compensated by the advertisers that appear on the website, based on your interaction with the advertisements or advertisers.
© 2007-2024 - Fusion Media Limited. All Rights Reserved.