Talk is cheap; the price of action is colossal
That line, from the play Marat/Sade, pretty much sums up the European position on Russia. Many government officials have been talking harshly about the need to penalize Russia for its alleged involvement in the downing of the Malaysia Air plane over Ukraine, but when push came to shove, nobody shoved. The EU increased the list of people and companies facing asset freezes and travel bans, but said they would consider tougher measures only if Russia doesn’t cooperate in the investigation of the plane. The European Commission is now expected to publish tomorrow a list of harsher economic and trade sanctions that the EU could implement if things don’t go well.
This may not have been a great day for standing up for principle, but markets are generally apolitical. The fact that tensions were lowered switched sentiment from “risk off” to “risk on.” Stocks in Europe recovered smartly and the rally carried over into US and Asian equities too, while gold and Bund prices fell. The risk-sensitive commodity currencies were the best performing G10 currencies while the safe-haven CHF was the worst.
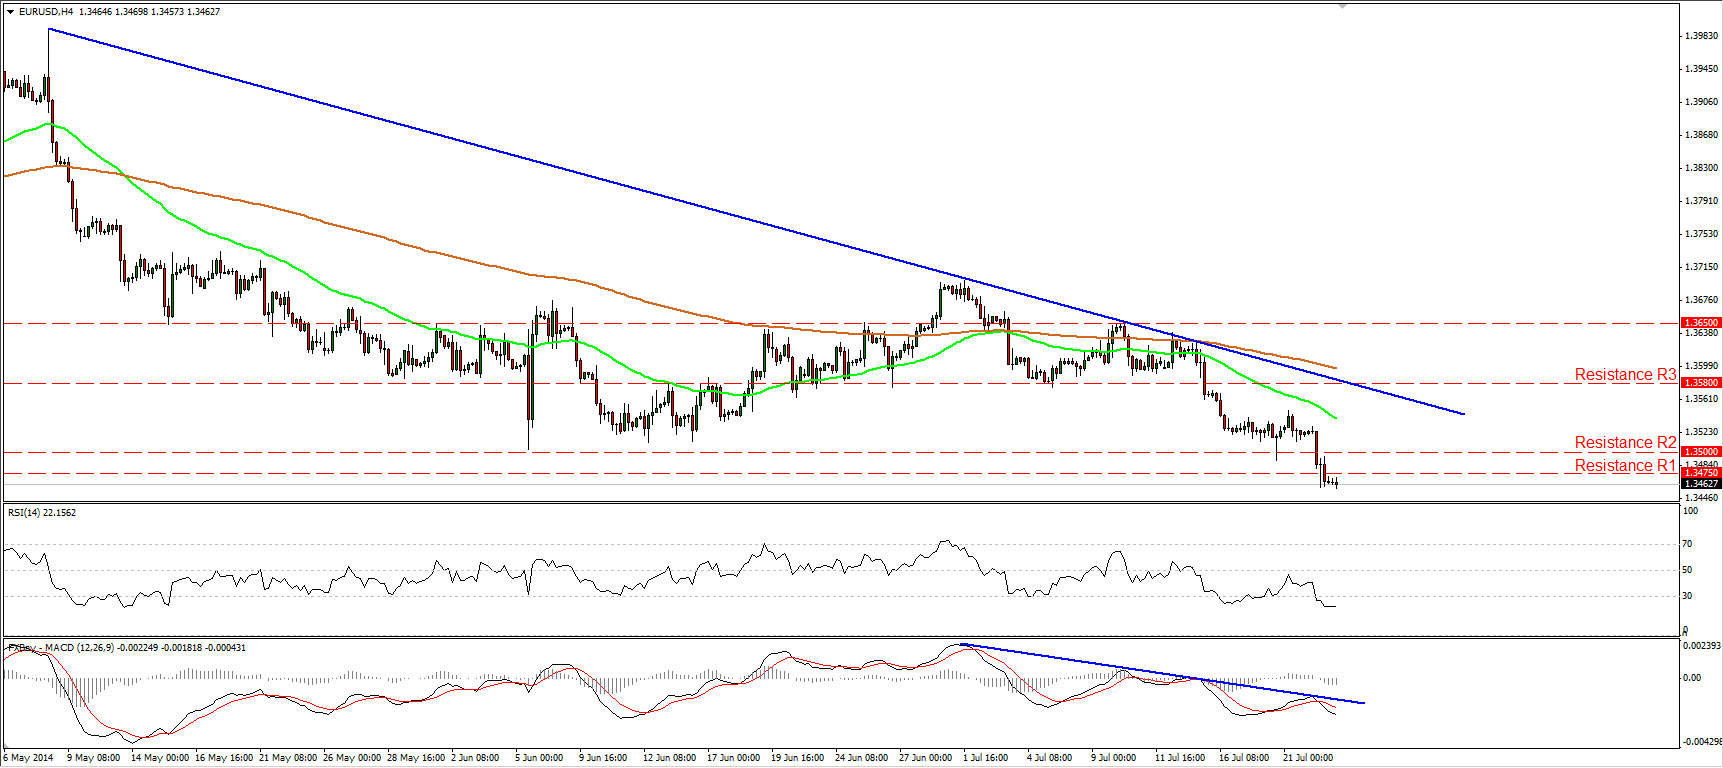
Against what should have been a favorable background for European assets and hence EUR, it’s particularly notable that EUR/USD is opening in Europe below 1.3500 for the first time since 3 Feb (and even that was only one day; the last time it was down here for any sustained period of time was last November). The weakness seems to be caused by the view that European growth has stalled and with the ECB on hold, the only thing that can rescue Europe is a weaker euro. For example, even while the IMF declaring that Spain has “turned the corner,” the country’s exports are falling and the trade deficit is widening out again, endangering the recovery. We will know more tomorrow when the preliminary PMIs for July are released. The Eurozone PMIs are forecast to be only a touch weaker, so there seems to me to be plenty of room for disappointment. Meanwhile, the technical picture for EUR/USD is also negative (see below). This could be the break we EUR bears have been waiting for for so long.
On the other hand, EM currencies continue to gain. The RUB was the best-performing EM currency of the ones we track, followed closely by the high-yielding TRY, ZAR and BRL. EM currencies may be benefitting from the capital flight from Russia as investors (and locals) pull out of that market and put their money elsewhere. Carry trades look set to perform well even if “risk off” returns, because of the lack of contagion to other EM countries.
Q2 CPI from Australia was in line with forecasts at +3.0% yoy, up slightly from +2.9% yoy in Q1. The news sent AUD sharply higher despite the fact that the headline figure and “weighted median” were exactly as forecast, because the “trimmed mean” figure rose faster than expected at 2.9% yoy, up from 2.6% yoy and exceeding estimates of 2.7% yoy. The higher inflation rate makes it less likely that Australia might cut rates in the foreseeable future.
Today: During the European day, the only data we get are manufacturing confidence data from France and the preliminary consumer confidence for Eurozone, both for July.
In the UK, the Bank of England releases the minutes of its latest policy meeting. Recent comments and speeches by MPC members, plus the minutes of recent meetings, indicate that at least some members have moved closer to a dissenting vote, but I doubt that it will come this month. With no outright dissent, the focus will be on the range of views on spare capacity among MPC members and the debate about when to start raising rates. Separately, BoE Governor Mark Carney will speak to a business conference.
From the US, we get the MBA mortgage applications for the week ended on the 18th of July and as usual no forecast is available.
In Canada retail sales for May are expected to slow to +0.3% yoy from +0.7% yoy in the previous month.
ECB Executive Board member Peter Praet speaks.
EUR/USD below the lows of February
The EUR/USD declined significantly on Tuesday, falling below the psychological barrier of 1.3500 and breaking below the lows of February at 1.3475. I believe the move sets the stage for larger bearish extensions, opening the way towards the 1.3400 (S1) support area, marked by the low of the 21st of November. The MACD remains below its blue resistance line and below both its zero and signal lines, confirming yesterday’s negative momentum. The RSI dipped within its oversold zone, but it’s pointing sideways. I would search for a price bounce upon its exit from the extreme area. In the bigger picture, the move below the 1.3475 hurdle confirms a forthcoming lower low, while the 50-day moving average touched the 200-day one and a bearish cross in the near future will add to the negative outlook of the pair.
• Support: 1.3400 (S1), 1.3300 (S2), 1.3250 (S3)
• Resistance: 1.3475 (R1), 1.3500 (R2), 1.3580 (R3)
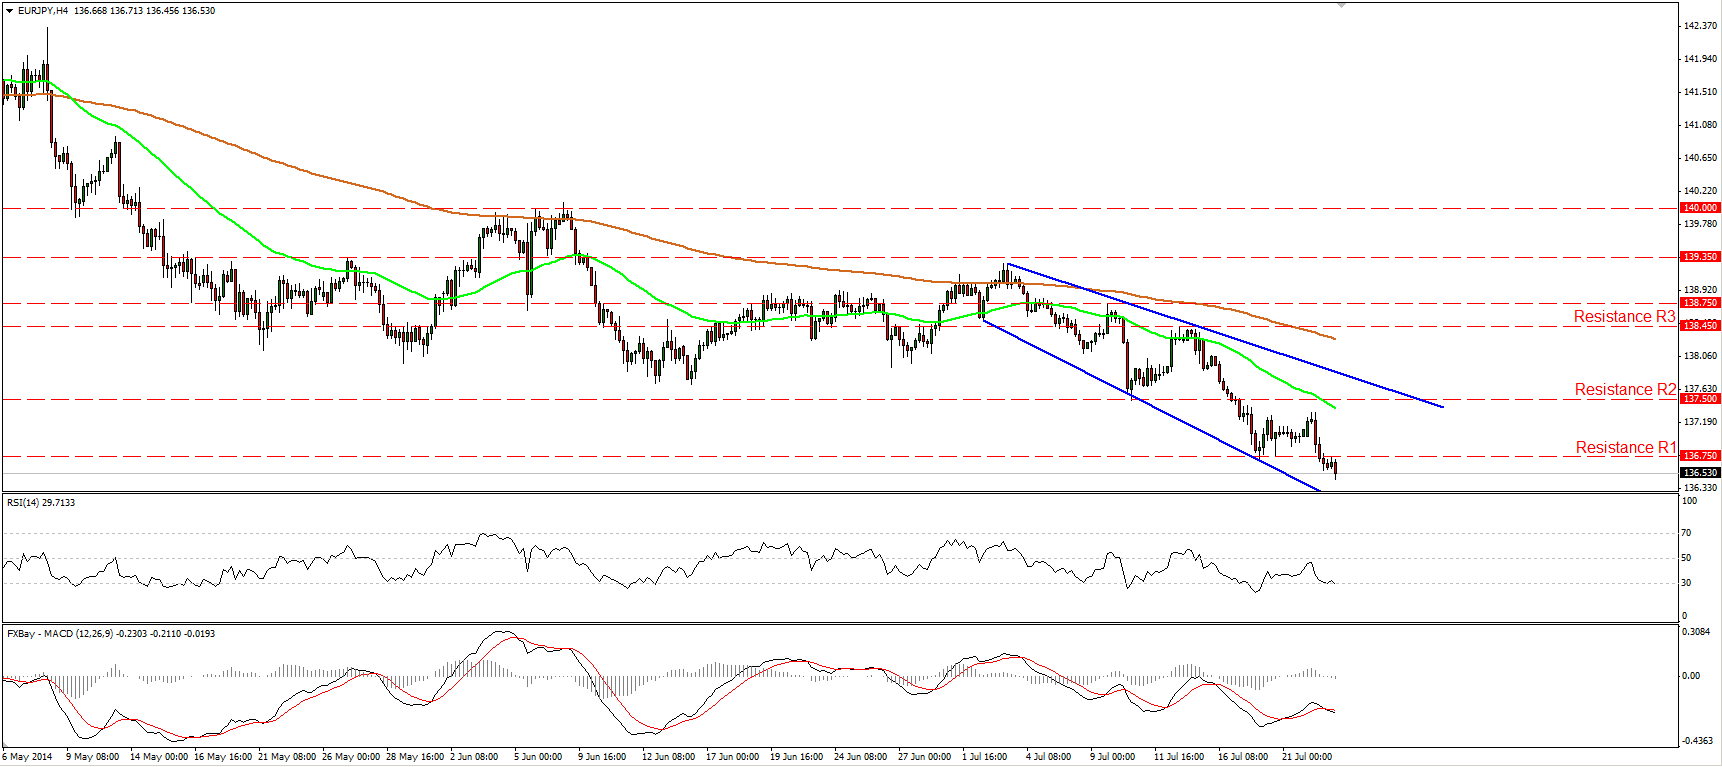
EUR/JPY breaks below 136.75
The EUR/JPY moved lower and fell below the 136.75 (support turned into resistance). The move confirms a forthcoming lower low and could pave the way towards the support obstacle of 136.20 (S1). The MACD, already below zero, fell below its signal line, confirming the accelerating bearish momentum of the price action. As long as the rate is trading below the blue downtrend line and below both the moving averages, the short-term path remains to the downside. On the daily chart, the 50-day moving average is getting closer to the 200-day moving average and a bearish cross in the future will add to the negative outlook of EUR/JPY.
• Support: 136.20 (S1), 135.50 (S2), 135.00 (S3)
• Resistance: 136.75 (R1), 137.50 (R2), 138.45 (R3)
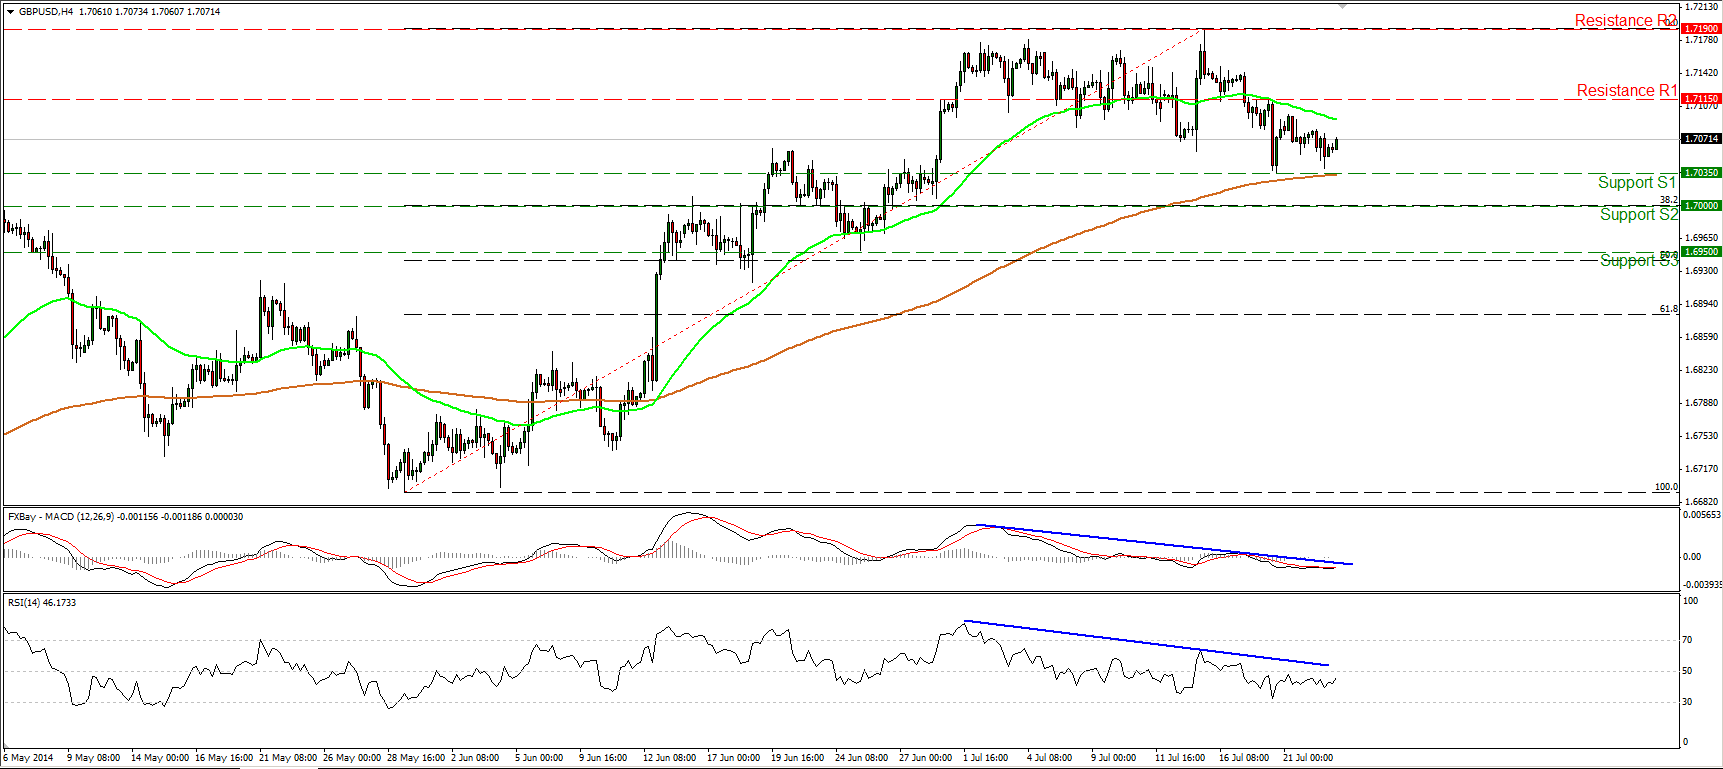
GBP/USD waits for the BoE minutes
The GBP/USD moved slightly lower, but found support once again near 1.7035 (S1), marginally above the 200-period moving average. The negative divergence between our momentum studies and the price action remains in effect and indicates that the pair may be topping and keeps the near-term outlook mildly to the downside. However, today the BoE releases the minutes of its latest policy meeting and much of today’s movement will depend on that. As a result, I would remain on the sidelines until I get more pieces of the puzzle to fill out the pair’s short-term picture. On the daily chart, the 80-day exponential moving average continues to provide reliable support to the lows of the price action. This keeps the long-term path to the upside and as a result, I would see any possible near-term declines as a correcting phase of the major uptrend.
• Support: 1.7035 (S1), 1.7000 (S2), 1.6950 (S3)
• Resistance: 1.7115 (R1), 1.7190 (R2), 1.7300 (R3)
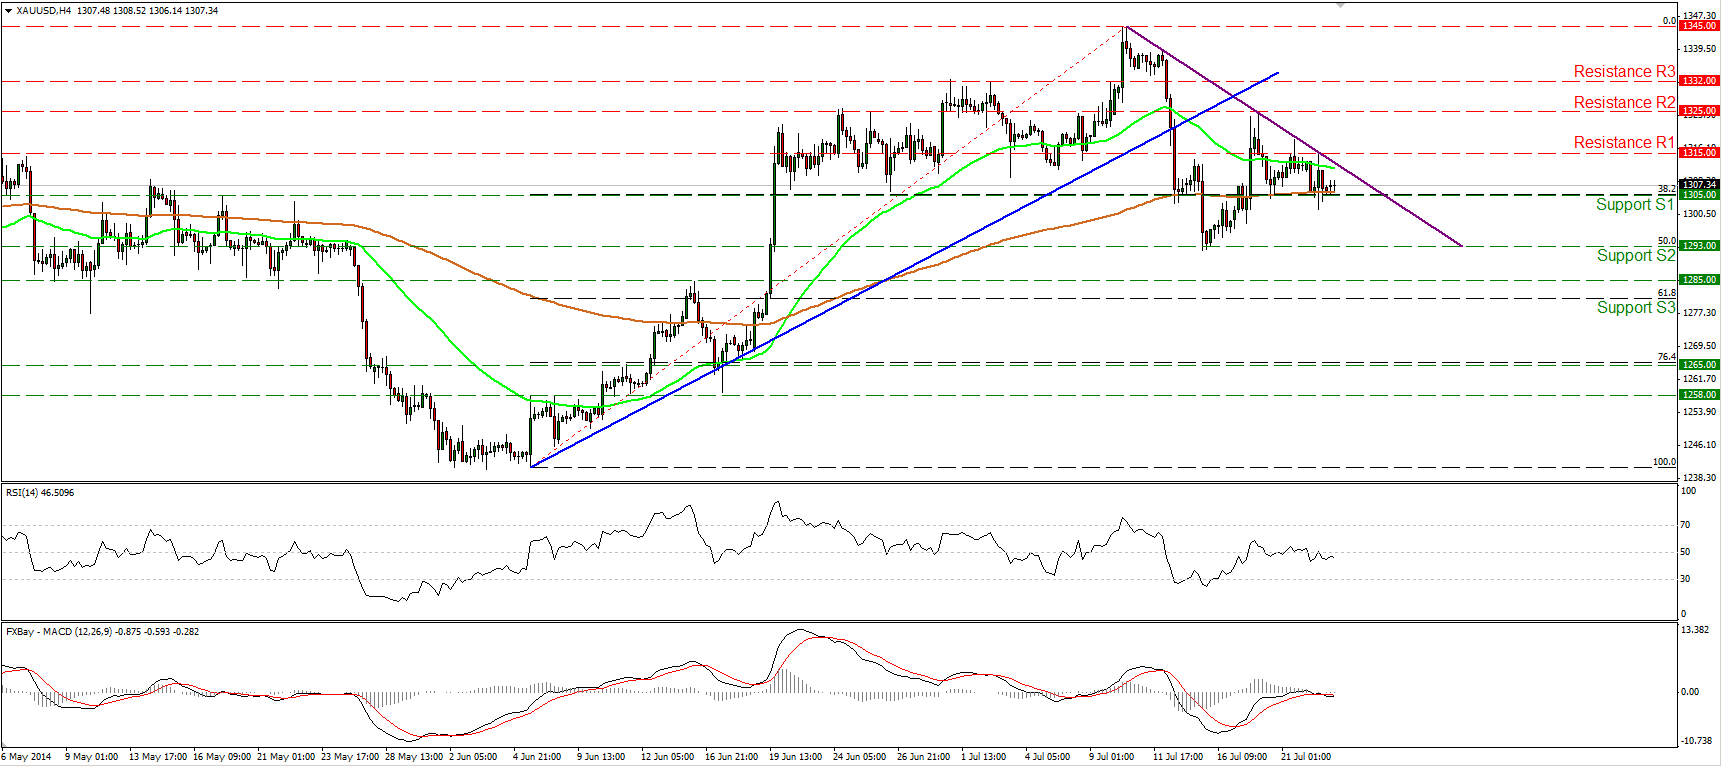
Gold’s picture remains unclear
Gold declined somewhat during the early European morning Tuesday, but was halted once again by the 1305 (S1) level, which coincides with the 200-period moving average. Later in the day, the metal tried to move higher but found resistance at 1315 (R1) and the purple downside trend line. Taking into account that the price remains below the purple trend line, but well supported by the 1305 (S1) zone, I would maintain my neutral view. Both the RSI and the MACD remain near their neutral levels, while on the daily chart, both the 50- and the 200-day moving averages are pointing sideways, adding to the unclear picture of the yellow metal.
• Support: 1305 (S1), 1293 (S2), 1285 (S3)
• Resistance: 1315 (R1), 1325 (R2), 1332 (R3)
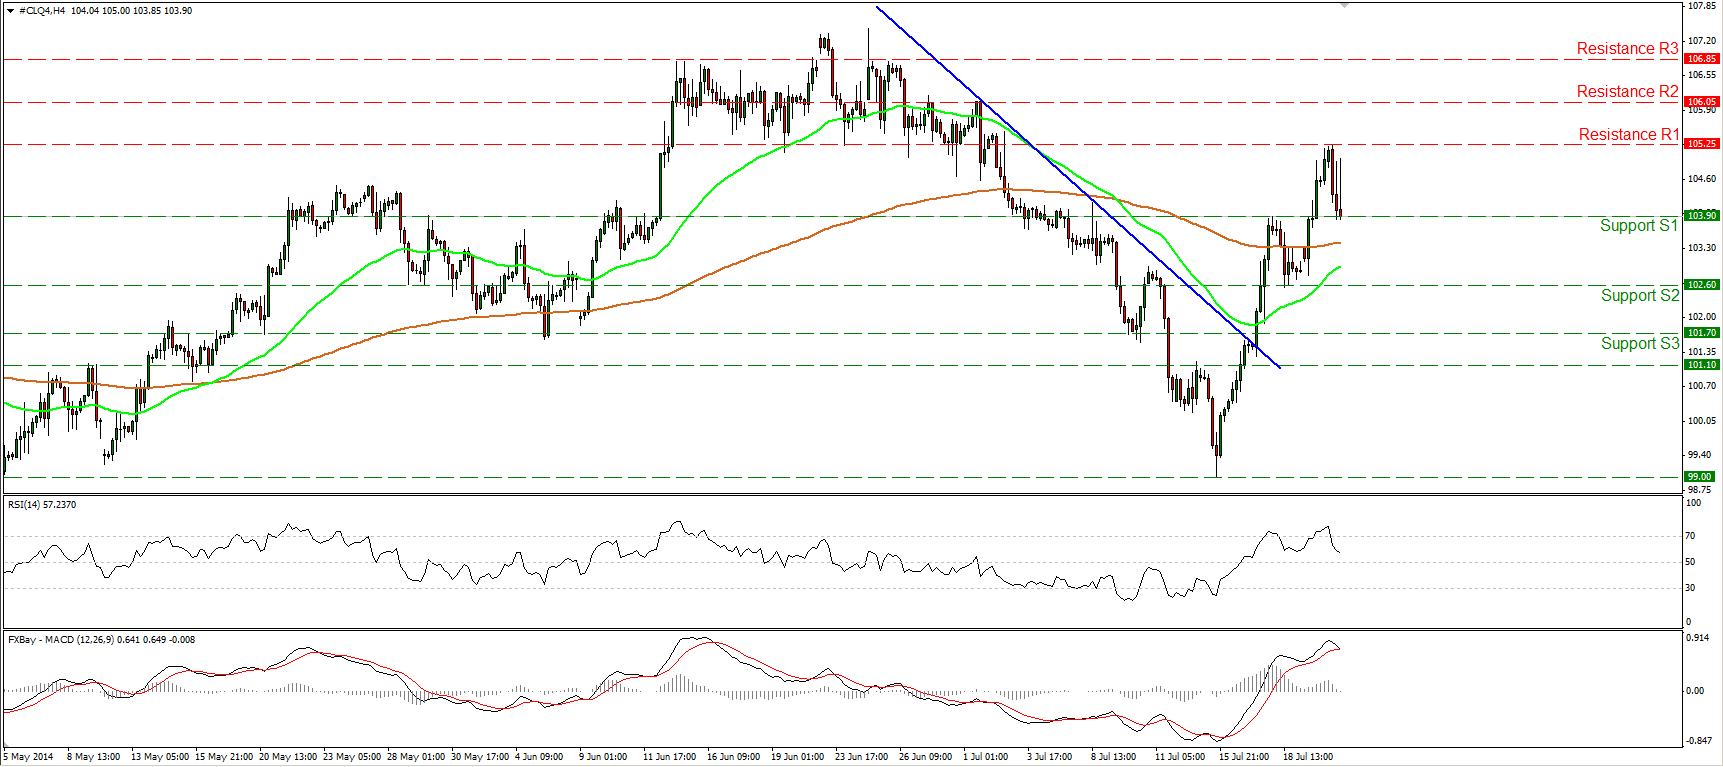
WTI fails to sustain above 105.00
WTI tried to move above 105.00, but the attempt was unsuccessful. The price found some selling orders above that level and after finding resistance at 105.25 (R1), it fell sharply to hit the support barrier of 103.90 (S1). Although the possibility of a higher low still exist and this keeps the short-term uptrend intact, having in mind the sharp tumble, I would change my view from positive to neutral. Moreover, the RSI moved lower after exiting its overbought zone, while the MACD seems ready to move below its trigger line. Zooming on the 1-hour chart, I can see negative divergence between the price action and both the hourly momentum studies. The momentum signals are not so encouraging at the moment and this is another reason I would remain flat for now.
• Support: 103.90 (S1), 102.60 (S2), 101.70 (S3)
• Resistance: 105.25 (R1), 106.05 (R2), 106.85 (R3)

