The dollar gained against a broad basket of currencies after research from the San Francisco Fed published on Monday noted that large financial institutions that do business directly with the central bank see a more modest pace of rate increases than is indicated by Fed officials. Ahead of the next FOMC policy meeting on Sept. 16-17, the greenback surged against all of its G10 peers in an attempt to re-price the path for interest rate hikes to be more in line with the thinking of the FOMC.
Bank of Japan released the minutes of its August 7-8 monetary policy meeting, when the board maintained policy target unchanged as was widely expected. The minutes showed that most members shared the recognition that the Bank would continue with quantitative and qualitative monetary policy easing to achieve the price stability target of 2% as long as it was necessary. In recent comments BoJ Governor Haruhiko Kuroda said “I do not believe that a weakening yen is unfavorable for the Japanese economy” and considering the diverging paths of monetary policy in the US and Japan, we expect that this will most likely be the case.
Today’s action: During the European day, we get UK’s industrial production for July. The market consensus is for the monthly figure to slow down, while the annual rate is expected to accelerate. The country’s trade balance for July is also coming out and the forecast is for the deficit to narrow a bit. The data may be overlooked though as investors focus on the very tight race for and against Scottish independence. A poll by TNS-BMRB released overnight confirmed that the two sides are tied. This is important because it is the second polling company to show this result, which means the first one was not just a methodological fluke. Moreover, this company, the largest polling firm in the UK, has up to now shown one of the largest leads for the "no" side. The poll confirms that the momentum is with the "yes" side, which is likely to weigh on the GBP almost regardless of the result of today's indicators.
In the US, only economic indicators of secondary importance are released. NFIB small business optimism for August is forecast to remain near its highest level since October 2007. The Job Opening and Labor Turnover Survey (JOLTS) report for July is also due out and the forecast is for the number of job openings to increase marginally. While this indicator is not particularly market-affecting, it adds to the positive side of the mixed employment report released on Friday.
From Canada, we get housing starts for August. Following the rate decision last week, Bank of Canada mentioned that the activity in the housing market has been stronger than anticipated. The four straight above-forecast prints of housing starts confirm the Bank’s statement and increase the likelihood for another better-than-expected reading, which may strengthen CAD somewhat.
We have no speakers on Tuesday’s agenda.
The Market
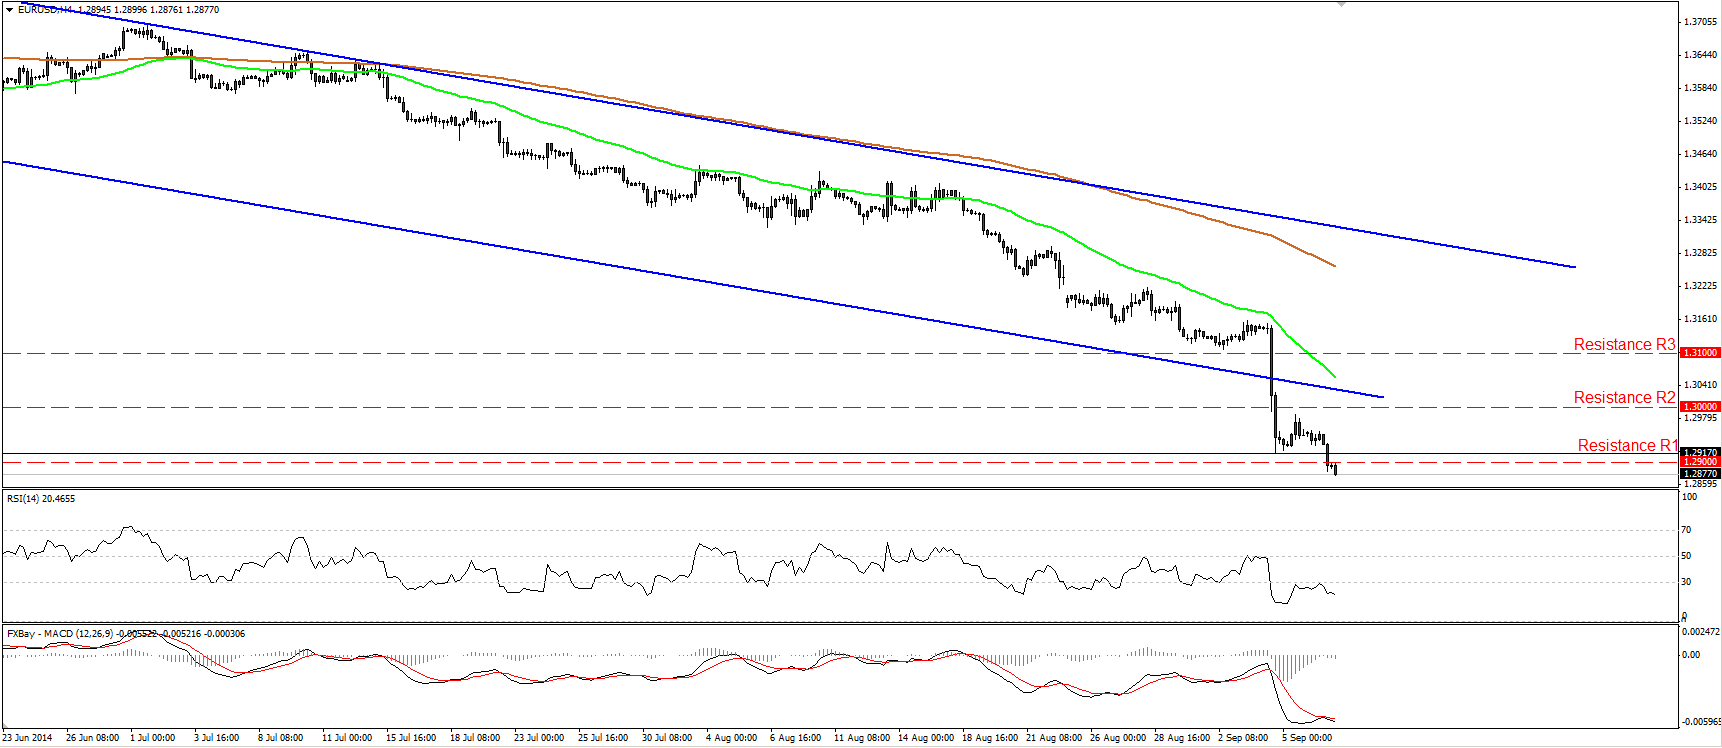
EUR/USD dips below 1.2900
EUR/USD tumbled on Monday, breaking below the 1.2900 line (support turned into resistance). As I mentioned in previous comments, I would expect such a dip to set the stage for larger bearish extensions and to pave the way for the next key support zone of 1.2760 (S1), defined by the lows of March and July 2013. Looking on our momentum studies, the RSI, already within its oversold field, found resistance at its 30 line and moved lower, while the MACD, despite signs of bottoming, remained below its trigger line and turned down. This designates strong bearish momentum and amplifies the case for further declines. In the bigger picture, the pair is still forming lower highs and lower lows below both the 50- and the 200-day moving averages, thus the overall path of the rate remains to the downside.
• Support: 1.2760 (S1), 1.2660 (S2), 1.2500 (S3).
• Resistance: 1.2900 (R1), 1.3000 (R2), 1.3100 (R3).
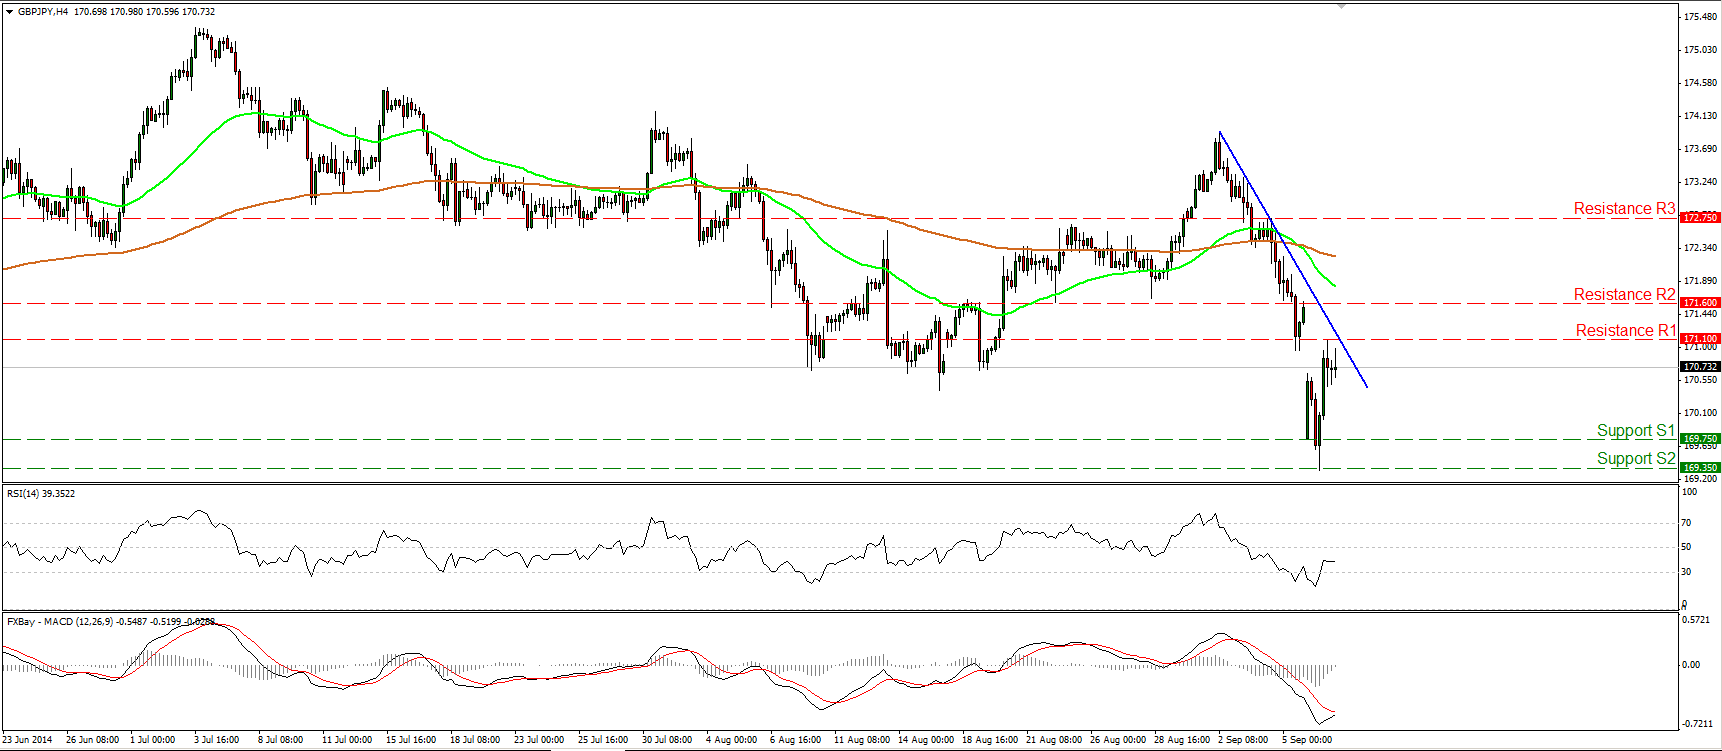
GBP/JPY rebounds from near the 200-day EMA
GBP/JPY fell sharply after forming a shooting star candlestick on the 2nd of September (see daily chart). However, yesterday, the pair found support at 169.35 (S2), near the 200-day moving average and rebounded strongly. As long as the rate is trading below the blue near-term downtrend line, I still see a cautiously negative picture, but I would wait for a dip below the 200-day moving average to carry larger bearish implications. The pair has been trading above that moving average since October 2012, thus I would expect a possible dip below it in the future to be critical.
• Support: 169.75 (S1), 169.35 (S2), 168.60 (S3).
• Resistance: 171.10 (R1), 171.60 (R2), 172.75 (R3).
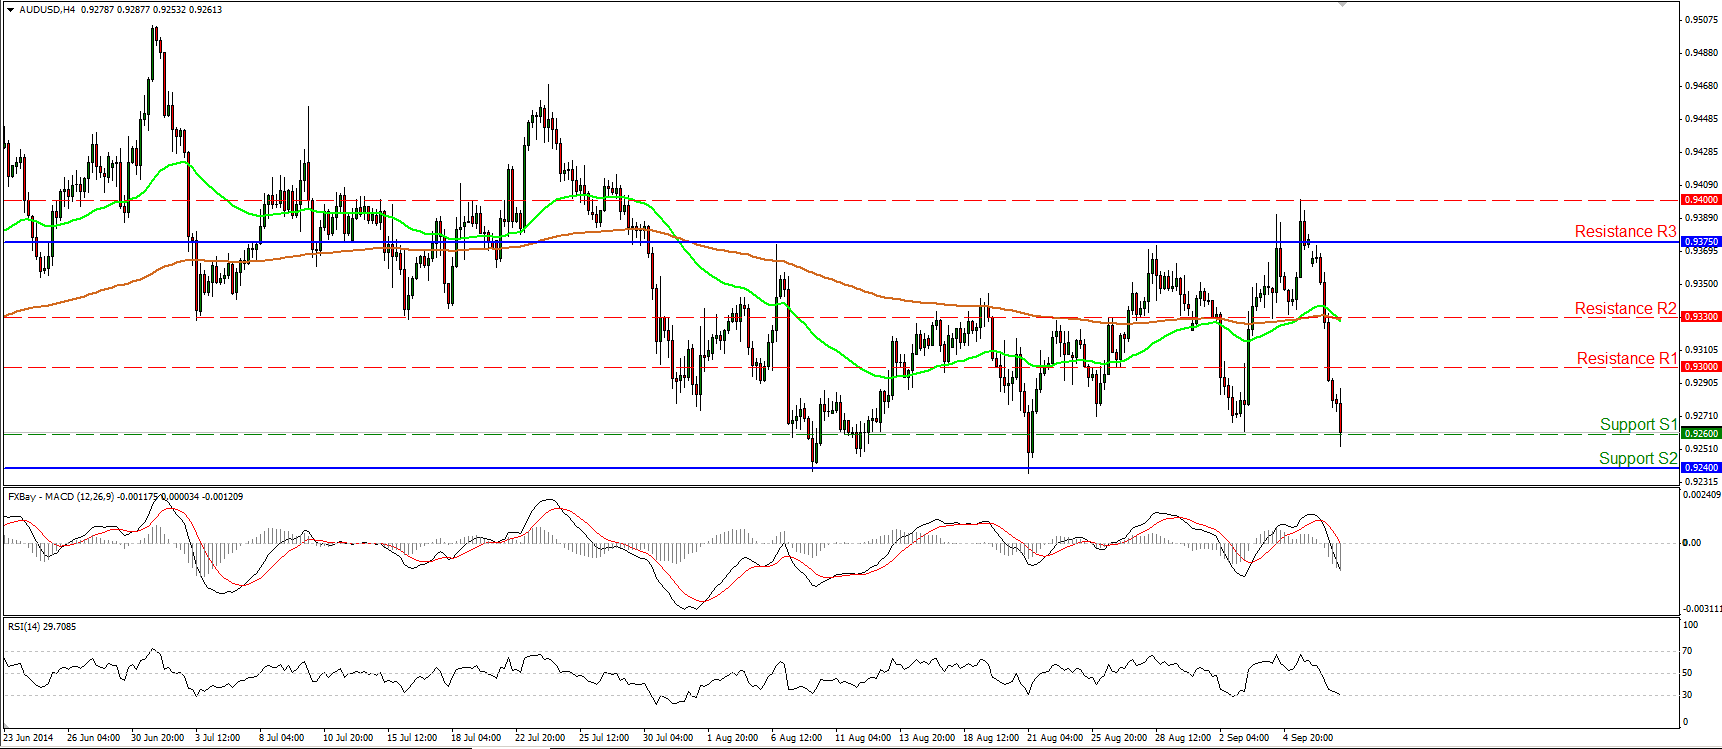
AUD/USD plunges but still within a range
AUD/USD plunged yesterday, violating two support lines (turned into resistance) in a row. However, the fall was halted by 0.9260 (S1), where a break is likely to see support at 0.9240 (S2). Taking a look at the broader picture, the pair is still trading within a sideways path, between the support zone of 0.9240 (S2) and the resistance of 0.9375 (R3). As a result, I would expect a clear and decisive close below 0.9240 (S2) to signal the downside exit of the range. Such a move is likely to challenge the key line of 0.9200 (S3). The 50-and the 200-day moving averages are pointing sideways, confirming the trendless mode of the currency pair.
• Support: 0.9260 (S1), 0.9240 (S2), 0.9200 (S3).
• Resistance: 0.9300 (R1), 0.9330 (R2), 0.9375 (R3).
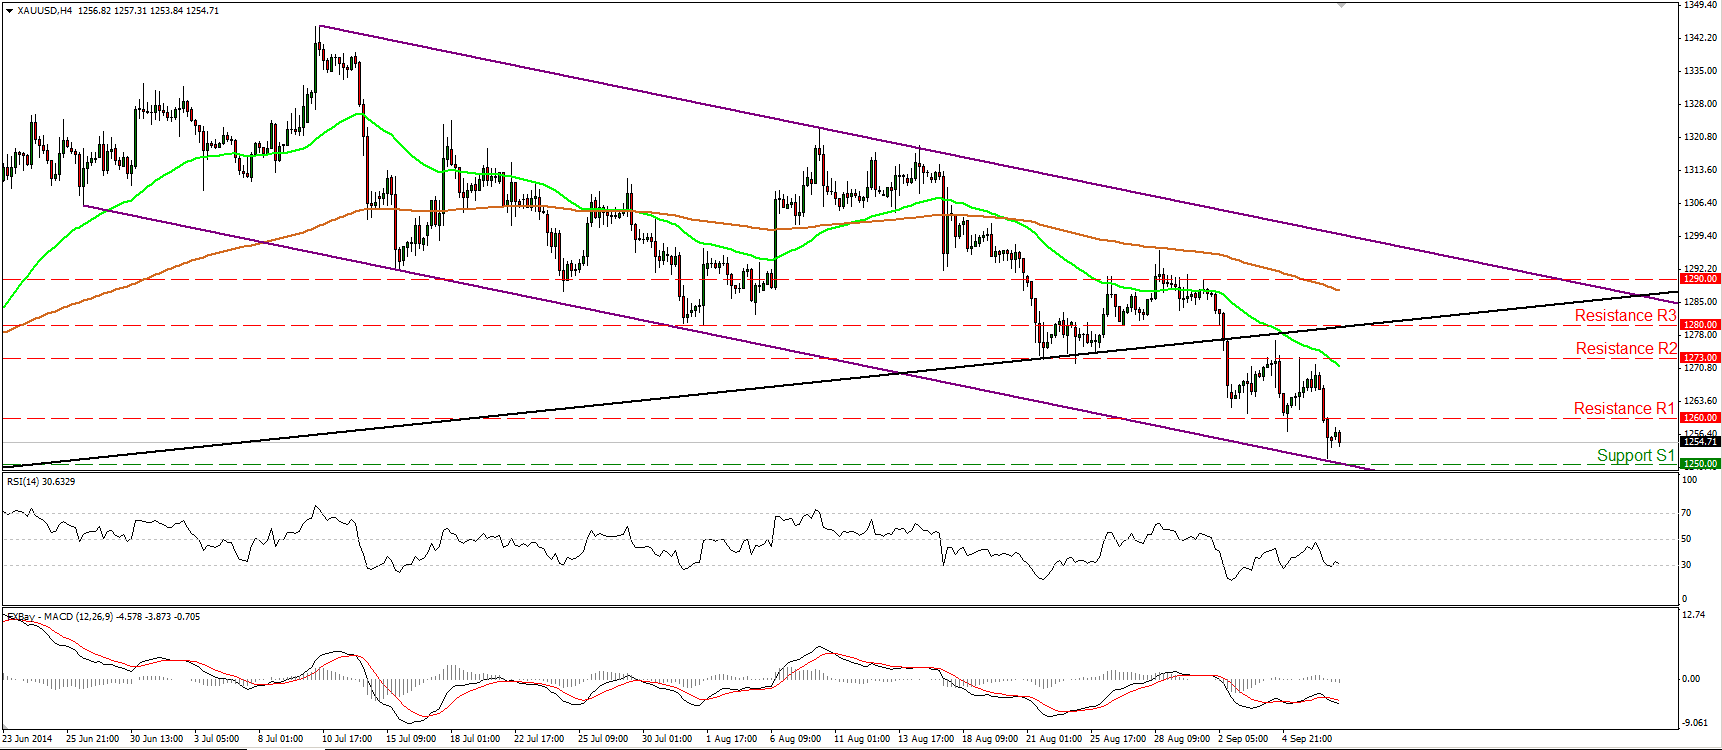
Gold falls below 1260
Gold declined yesterday, after finding resistance slightly below the 1273 (R2) line. The precious metal violated the 1260 barrier (support turned into resistance), but the decline was halted one dollar above our next support of 1250 (S1), near the lower boundary of the purple downside channel. Given our proximity to the lower line of the channel, I would be cautious of a possible upside corrective move in the near future. Nevertheless, as long as the metal is trading within the aforementioned downside channel and below the black line drawn from back at the low of the 30th of December, I consider the overall path to be to the downside.
• Support: 1250 (S1), 1240 (S2), 1230 (S3).
• Resistance: 1260 (R1), 1273 (R2), 1280 (R3).
WTI find support slightly above 91.60
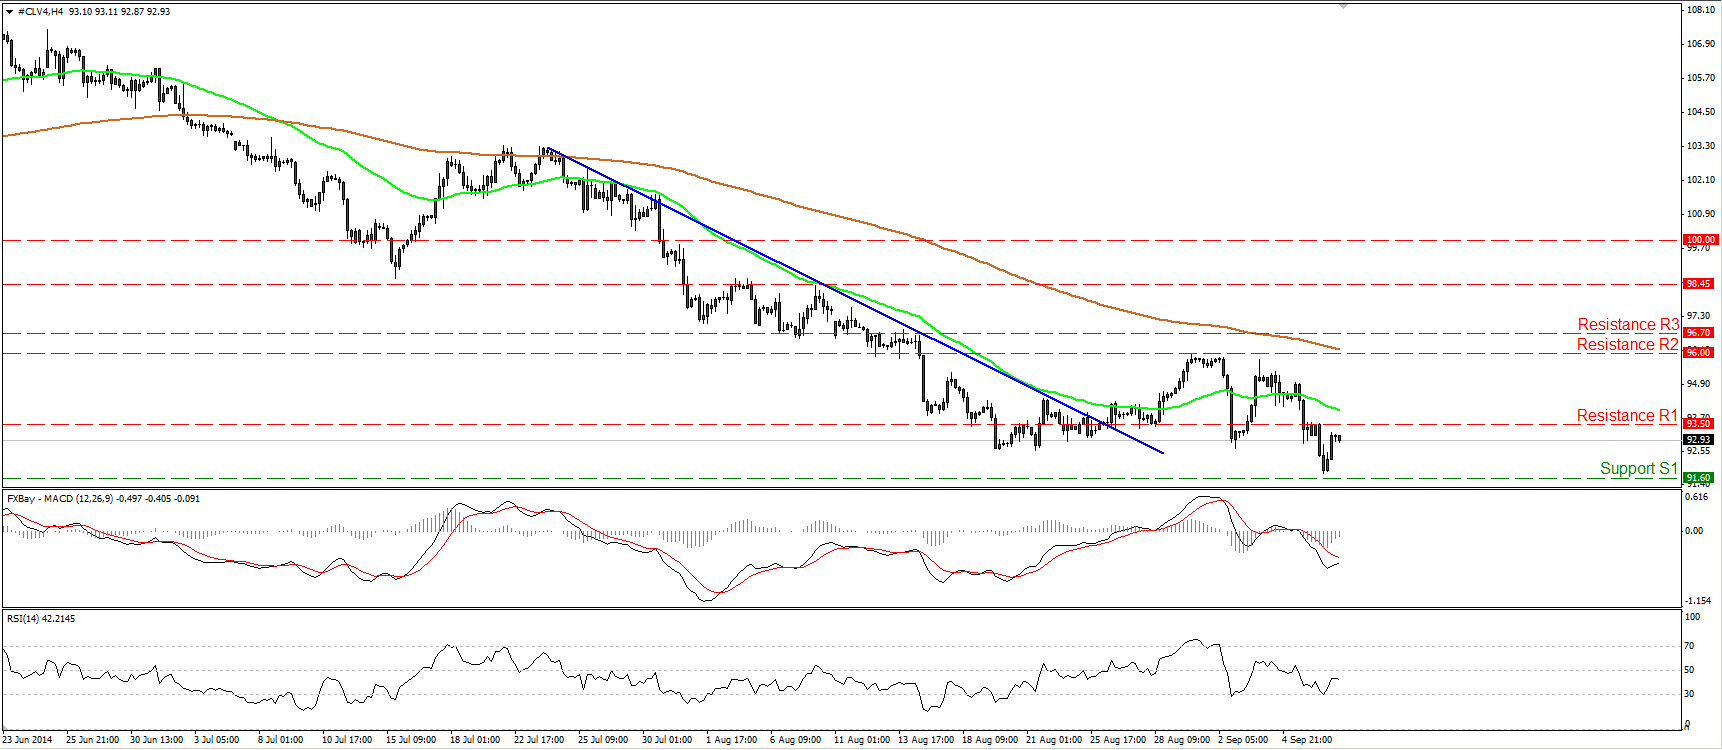
WTI continued declining yesterday, but it rebounded somewhat after finding support marginally above our barrier of 91.60 (S1). Yesterday’s move confirmed a lower low and turned the outlook mildly to the downside. Nevertheless, I believe that a decisive downside violation of 91.60 (S1) is the move that could carry larger bearish extensions. Such a break is likely to open the way for the psychological line of 90.00 (S2). On the daily chart, the price structure remains lower peaks and lower troughs below both the 50- and the 200- day moving averages, but I see positive divergence between the RSI and the price action, while the MACD remains above its trigger line. This supports my view to wait for a clear move below 91.60 (S1) before getting more confident on the downside.
• Support: 91.60 (S1), 90.00 (S2), 87.75 (S3).
• Resistance: 93.50 (R1), 96.00 (R2), 96.70 (R3) .

