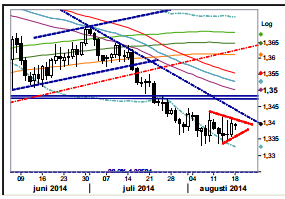
EUR/USD: Triangle case running out time?
Eight out of the past nine trading days the market has been pushing prices below 1.3360 but not on one single occasion been able to end the day below 1.3360. There’s apparently a significant bid in the area counteracting the bearish triangle that we have been creating during last week. The triangle is more or less complete so if a downside break (a minimum move to 1.3332 (ideally 1.3250)) doesn’t take place within shortly the risk will swing to the topside (breaking 1.3416).
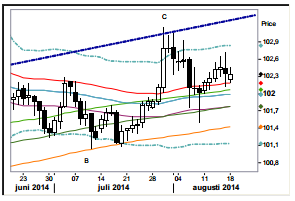
USD/JPY: Downside risk mounting.
After Friday’s price action creating a second consecutive spinning top (and this time also close to being a key day reversal) downside pressure should be mounting. An hourly bear flag has been created since the Friday low and breaking below 102.20 (the b-wave of the hourly bear flag) should set another downside move in motion.
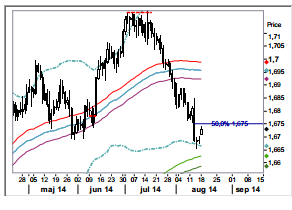
GBP/USD: Approaching the mid body point. The upward reaction following the falling benchmark candle last week is now approaching the primary goal for the correction, the mid body point at 1.6750. If following the textbook a new round of weakness should then follow primary targeting the 233d ma band. So strategy for today should be to try to sell into strength with a tight stop.
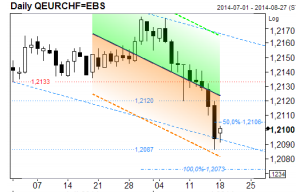
EUR/CHF: Targeting 1.2073 next. A 21day 2std dev band is clearly negatively sloped but also currently indicates a short-term stretch below 1.2080. But a short-term "Equality point" at 1.2073 is anyway the next target below. Plentiful resistance is located in the 1.210620 zone – could be tested, but likely to attract responsive selling. Current intraday stretches are located at 1.2082 & 1.2119.
cdn.com/content/pic416f9f3bfda2c3ef34ba3b7b0df1fb6c.PNG" alt="USD/JPY Daily Chart" title="USD/JPY Daily Chart" height="200" width="450" />
GBP/USD: Approaching the mid body point. The upward reaction following the falling benchmark candle last week is now approaching the primary goal for the correction, the mid body point at 1.6750. If following the textbook a new round of weakness should then follow primary targeting the 233d ma band. So strategy for today should be to try to sell into strength with a tight stop.
EUR/CHF: Targeting 1.2073 next. A 21day 2std dev band is clearly negatively sloped but also currently indicates a short-term stretch below 1.2080. But a short-term "Equality point" at 1.2073 is anyway the next target below. Plentiful resistance is located in the 1.210620 zone – could be tested, but likely to attract responsive selling. Current intraday stretches are located at 1.2082 & 1.2119.


