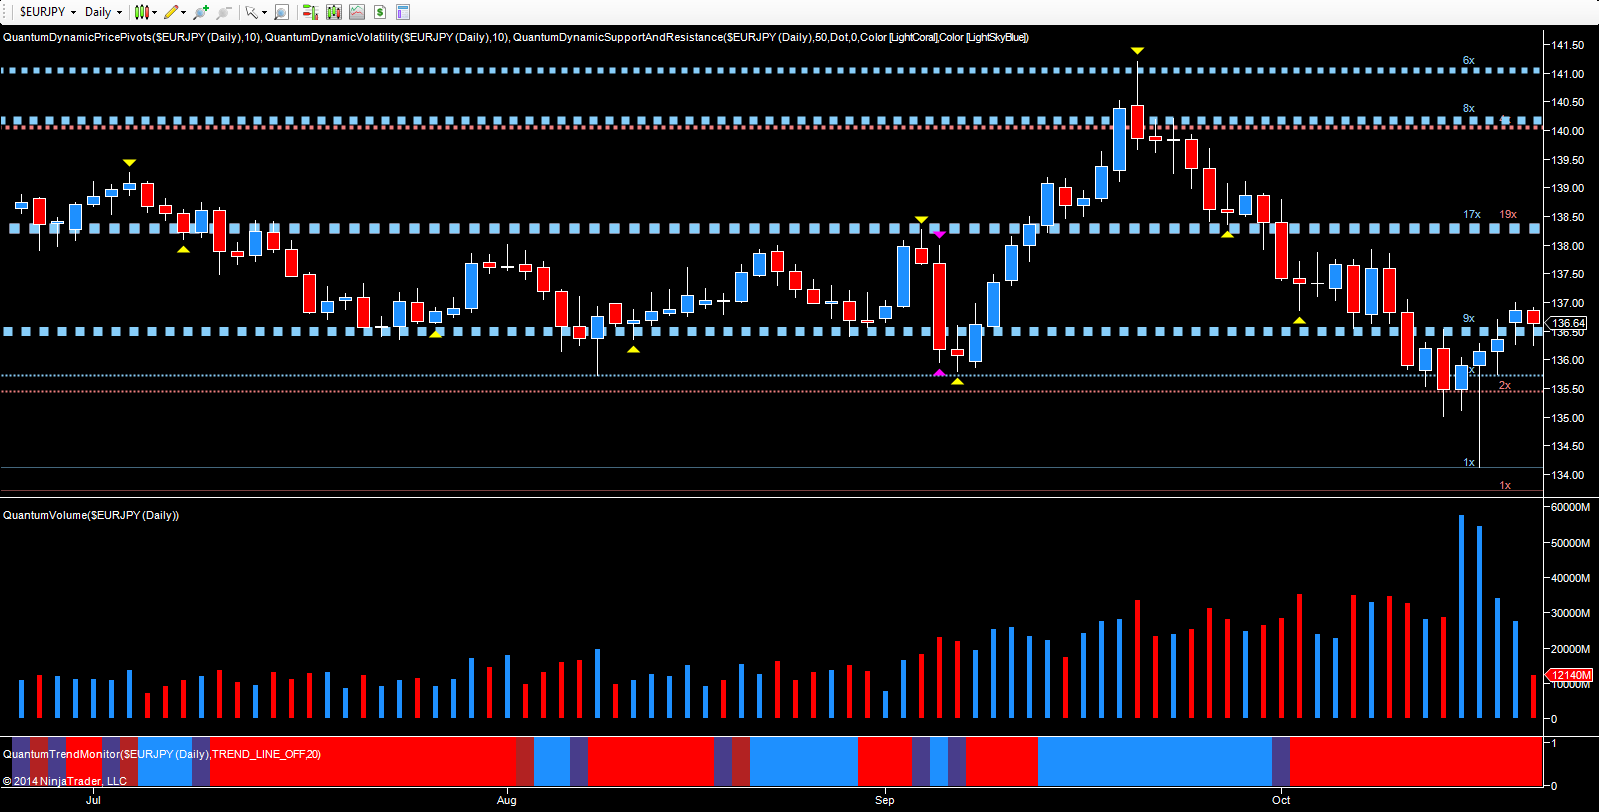
As with many of the yen currency pairs over the last few days, volatile price action in related markets has been mirrored in these pairs, with the EUR/JPY in particular delivering a classic example of the power of volume price analysis in action. The decline in the pair was initially signaled with the weak candle of the 19th September, which closed with a deep upper wick, testing resistance in the 141.00 region, as denoted with the blue dotted line and high volume on the day. This weakness was also clearly evident in the equity cash markets with extreme volumes on a shooting star candle and validating once again the relationships that exist between markets, linked and underpinned by money flow and sentiment.
The initial weakness was duly validated with the pivot high topping the candle with the pair then moving lower driven both by euro weakness, but more importantly by yen strength, as risk aversion dominated investor sentiment. As the market sold off, so volumes on the down candle increased, with the pair breaching two key support levels in the move lower, the first at 138.40 and the second at 136.60, before finally arriving at the seminal turning point last week.
Last Wednesday’s price action sent the first clear and unequivocal signals of a potential reversal in sentiment, both for the pair and for the broader markets, as ultra high volume and a narrow spread candle sent a strong signal of stopping volume in the 135.50 area, with the market makers starting their initial phase of buying following the steep falls over the previous weeks. This is akin to the oil tanker, which has momentum and just like the market will continue to move even when the engines are stopped.
It’s the same principle here. For any market to reverse, it takes time for the market makers and big operators to absorb all the selling pressure in a single candle or bar. Last Thursday’s price action was even more descriptive, delivering yet another unequivocal sign that the bearish trend was coming to an abrupt end with a second day of ultra high volume, coupled with an extreme hammer candle as the pair tested the 134.20 region before closing the day higher at 136.15. Another classic sign of buying by the market makers, with the pair duly reversing and starting to move higher, regaining and holding above the resistance level in the 136.60 area which is being tested once more in early trading today.
After such an extreme example of stopping volume, it is always easy to forget two other aspects of the volume price approach. The first is the low volume test of supply, which we are now waiting for, before a sustained bullish trend develops; The second is the relative nature of volume which as always becomes distorted after such a dramatic increase. However, to re-calibrate is easy, simply by comparing the current volumes with those prior to these two, which then puts the current volume back into context.
As we can see, EUR/JPY is now moving higher on excellent volume, and in the medium term we can expect to see the pair rally further, and back to test the 138.25 region in due course, with a move through this area of resistance then opening the way to a move higher to test the 140.20. A classical lesson in volume price analysis delivered courtesy of the EUR/JPY on the daily chart, but which can be applied to any other market, any instrument and in any other timeframe. The only prerequisite is that the chart reports volume and price – the analysis element is then down to us!
