Market Brief
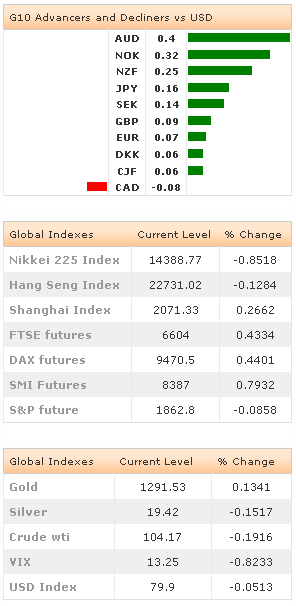
Nothing much has happened in FX markets during the Easter holidays. Low liquidities drove the markets. The US yields climbed above 2.70% on last week’s Philly Fed and lower jobless claims (below 4-week average of 312K). The G10 majors mostly pare losses vs. USD as holidays end.
The JPY started the week well offered amid the trade deficit widened significantly more than expectations. Japan printed -4,446.3bn yen deficit in March (vs. -800.3bn yen last & -1,427.6bn yen exp.), the exports slumped from 9.8% to 1.8%, imports hiked from 9.0% to 18.1%. The USD/JPY advanced to 102.73 in Tokyo. Resistance at 100-dma (102.95) and exporter offers keep the upside choppy pre-103.00, bids are seen above. The EUR/JPY trades flat at about the 100-dma (141.27). A daily close above 141.55 should send MACD into the bullish area but EUR risk remains.

The AUD/USD is better bid despite rumors of Australian Treasurer Hockey’s discontent with RBA’s neutral bias. The focus is on tomorrow’s CPI readings. The AUD inflation had surprised on the upside in Q4. Markets expect faster CPI y-o-y at 3.2%, versus 2.7% last quarter. If the expectations are confirmed, the hawkish RBA expectations should keep the AUD-bulls in place. The AUD/USD sees support above the 21-dma (0.9311). The next key resistance stands at 0.9499/0.9500 (Fib 76.4% on Nov’13 – Jan’14 pullback & psychological level).
The EUR/USD traded marginally lower in Asia and opens volatile as Europe comes back from Easter holidays. The big picture in EUR remains unchanged. The ECB threats keep the upside pressures subdued, yet do not trigger significant sell-off. The sentiment is uncertain, the deflation fears outweigh ECB risk at the moment. The EUR/USD tests support at 1.3781 (Fib 61.8% on Feb-Mar rally), more bids are seen at 1.3722 (Fib 50% & 100-dma). On the upside, resistance remains pre-1.3830, then 1.3906 (April high).
The Cable consolidates last week gains above 1.6775. Trend and momentum indicators are steadily bullish, the bias remains on the upside. The EUR/GBP is heading towards our target at 0.82042 (March 5th low). The support zone is placed at 0.81828 / 0.82000 (30-day lower BB / psychological support).
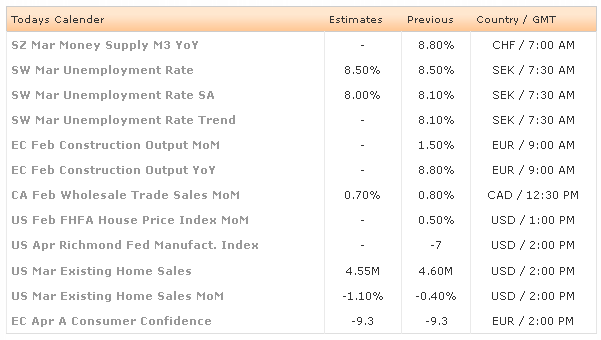
Today, the economic calendar consists of Swiss March M3 Money Supply, Swedish March Unemployment Rate, Euro-Zone February Construction Output m/m & y/y, Canadian February Wholesale Sales m/m, US February FHFA House Price Index, Richmond Fed April Manufacturing Index, US March Existing Home Sales m/m, Euro-Zone April (Prelim) Consumer Confidence.

EUR/USD
R 2: 1.3906
R 1: 1.3830
CURRENT: 1.3800
S 1: 1.3781
S 2: 1.3673
GBP/USD
R 2: 1.6880
R 1: 1.6842
CURRENT: 1.6811
S 1: 1.6775
S 2: 1.6661
USD/JPY
R 2: 104.13
R 1: 103.10
CURRENT: 102.43
S 1: 101.34
S 2: 100.76
USD/CHF
R 2: 0.8953
R 1: 0.8880
CURRENT: 0.8844
S 1: 0.8744
S 2: 0.8699
