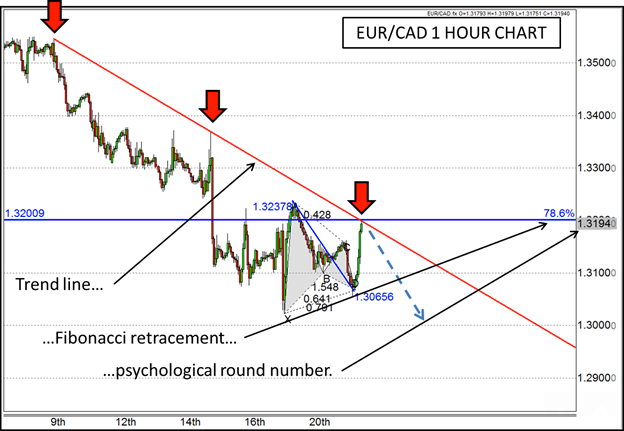
The early portion of the North American trading session has concentrated more on earnings in the equity market and happenings in Asia and Europe than anything policy or data driven in its own stomping ground. While Canada did release Wholesale Sales this morning that turned out much worse than anticipated, US releases haven’t been readily evident so far this week; plus the Canadian data is quite old having been a measure from February. Helping to alleviate the fear of a negative turn for the CAD is an atmosphere in Canada that has changed dramatically from the early months till now as the Bank of Canada, inflation, and employment in the Great White North turned more positive. A single economic miss on such an old indicator likely won’t change the tenor of positive CAD moves. However, that still doesn’t preclude the CAD from making waves every now and again, even against currencies that seem to be on the opposite end of the positivity spectrum.
The EUR/CAD is one such currency pair where the overall feel of each regions are starkly different. While BoC Governor Steven Poloz preaches patience and optimism, the European Central Bank’s President Mario Draghi seems much less enthusiastic, particularly when receiving confetti showers. Add in to the equation the fact that Greece could soon be making investors the world over quite nervous as we approach the end of the week, the EUR wouldn’t appear to be the most solid currency with which to ride. Despite the divergence of policy feel and market opinion, the EUR/CAD has rallied over 100 pips this morning thanks in large part to the bad sales figures I mentioned earlier.
Another potential reason that such a strong rally has taken hold is that a Bullish Gartley pattern was recently completed in this pair near 1.3060. If you were able to spot it in time, the jump higher would have been quite satisfying as it approached 1.32 despite the potential better judgement to not buy the EUR under any circumstance in such a volatile environment. But what if you missed it? Are you forever cast aside, never to use that pattern for future good? Not necessarily, it could be put to further use as the pattern’s aftermath comes to a close; and we may be quickly approaching that level.
Once a Gartley or Butterfly pattern completes, it is wise to try and determine where it will end. If the bullish pattern is going against the overall trend, as it is in this case, then looking for a trend line may be a logical course of action. In addition, seeking Fibonacci levels could be helpful in determining when the pattern’s effects will begin to wane. Luckily, in this pair, there is a trend line and a 78.6% Fibonacci retracement of the Gartley pattern’s A to D move in virtually the same area which also happens to correspond to a psychologically significant round number (1.32). If all of these factors were to join forces and create adequate resistance, the EUR/CAD rally may very soon come to an end.

Source: www.forex.com
For more intraday analysis and trade ideas, follow me on twitter (@FXexaminer ).
