
On Monday, April 29, the S&P 500 was, just before the close, at an all-time record peak. Yet very few folks seem to be talking about “selling high, and buying low.” If anything, a number of respectable analysts cheerily predict that any efforts to sell into market strength in May will be met quickly with a steady demand for buying into weakness.
Pushing The Buttons
The case for the endless stock rally hinges on the activity of the world’s central banks. Many contend that the U.S. Federal Reserve, the Bank of Japan as well as the European Central Bank (ECB) have been far more aggressive than they were in earlier years of the market’s rebound. Officials in charge of monetary policy have added hundreds of billions in bonds to bloated balance sheets, pushing yields lower and increasing risk appetite. Moreover, some countries are taking stakes in equities to further push asset prices higher.
Nevertheless, the pundit community may be ignoring the probability that central bank decisions are largely factored into the last 11 months already. The S&P 500 has gained ground in six consecutive months, 10 of the last 11, and may even claim 11 out of 12. Additionally, the S&P 500 has powered ahead without a 5% correction for more than 100 trading days… a rather uncommon actuality for any bull run. Equally compelling is the fact that a 5% pullback has occurred at least one time in the first five months of every year since 1996.
Is the ancient news of central-bank liquidity so powerful that it can override historical trading patterns, weak corporate revenue, a slowdown in global growth, serious debt troubles in the euro zone and the wisdom of “sell high, buy low?” While those with significant cash on hand may feel like they have been waiting on Mr. Godot or Mr. Guffman, they should recognize that Mr. Market’s “Hyde-side” always appears. My thought is that he will appear sooner, though admittedly, he may arrive later… much later.
Consider The S&P 500
If you have been more conservative, and if you have not captured as much of the 10%-11% year-to-date upside that an all-stock portfolio might have provided, consider the history of the S&P 500. Since 1950, the S&P 500 has compounded at an average rate of just 50 basis points (0.5%) over the May-September period. Granted, the season only represents averages and the “Sell in May” strategy has many flaws, particularly after a large-scale correction occurs early in the period. Still, what are the probable outcomes after a 10%-11% year-to-date rally through April 29?
The best portfolio moves over the coming half-year period will involve both growth and income. First, pursue reasonably priced ETFs with desirable monthly or quarterly income streams. Second, buy non-cyclical stock weakness on pullbacks of at least 5%-10%. (Note: Be sure that you understand the circumstances under which you might protect against further downside, rather than doggedly hold onto the idea that the world’s central banks have the cure-all to kill any bearish collapse in confidence.)
Income Funds
Income ETFs that one could use in the May-September period? I am fond of the low, duration-oriented PIMCO zero-to-five-Year High Yield (HYS) with its annualized 5.1% distributed monthly. I also believe that Powershares Emerging Market Sovereign Debt (PCY) is destined to reclaim its price highs while simultaneously offering an admirable annualized 4.8% distributed monthly. And I see a probable 6.0% annualized out of Market Vectors Preferred excl Financials (PFXF).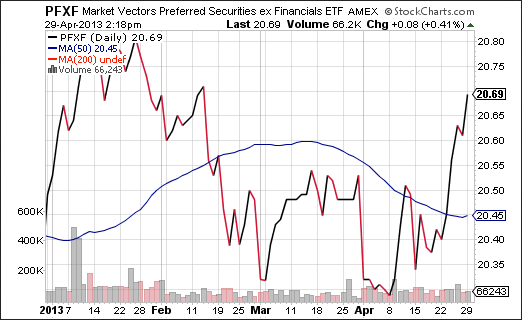
My criteria for equity ETFs is slightly different. First, you should be looking to purchase on a legitimate pullback. Otherwise, you are risking the high likelihood of price depreciation in the early stages of your acquisition. Next, if you are purchasing in the May-September cycle, it is preferable to concentrate on assets less tethered to economic growth. Some of my “faves” include Global X Super Dividend (SDIV), iShares Emerging Market Minimum Volatility (EEMV) and WisdomTree Equity Income (DHS).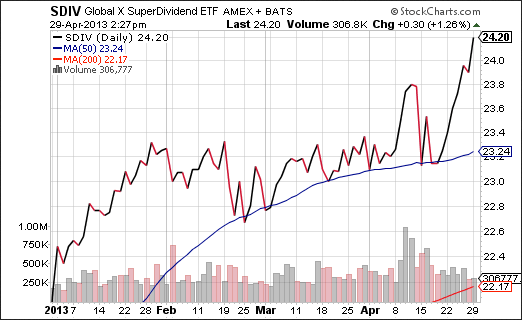
Disclosure Statement: ETF Expert is a web log (”blog”) that makes the world of ETFs easier to understand. Gary Gordon, MS, CFP is the president of Pacific Park Financial, Inc., a Registered Investment Adviser with the SEC. Gary Gordon, Pacific Park Financial, Inc., and/or its clients may hold positions in the ETFs, mutual funds, and/or any investment asset mentioned above. The commentary does not constitute individualized investment advice. The opinions offered herein are not personalized recommendations to buy, sell or hold securities. At times, issuers of exchange-traded products compensate Pacific Park Financial, Inc. or its subsidiaries for advertising at the ETF Expert web site. ETF Expert content is created independently of any advertising relationships.
- English (UK)
- English (India)
- English (Canada)
- English (Australia)
- English (South Africa)
- English (Philippines)
- English (Nigeria)
- Deutsch
- Español (España)
- Español (México)
- Français
- Italiano
- Nederlands
- Português (Portugal)
- Polski
- Português (Brasil)
- Русский
- Türkçe
- العربية
- Ελληνικά
- Svenska
- Suomi
- עברית
- 日本語
- 한국어
- 简体中文
- 繁體中文
- Bahasa Indonesia
- Bahasa Melayu
- ไทย
- Tiếng Việt
- हिंदी
ETFs You Should Be Buying (Or Waiting To Buy) In May
Published 04/29/2013, 03:42 PM
Updated 07/09/2023, 06:31 AM
ETFs You Should Be Buying (Or Waiting To Buy) In May
3rd party Ad. Not an offer or recommendation by Investing.com. See disclosure here or
remove ads
.
Latest comments
Install Our App
Risk Disclosure: Trading in financial instruments and/or cryptocurrencies involves high risks including the risk of losing some, or all, of your investment amount, and may not be suitable for all investors. Prices of cryptocurrencies are extremely volatile and may be affected by external factors such as financial, regulatory or political events. Trading on margin increases the financial risks.
Before deciding to trade in financial instrument or cryptocurrencies you should be fully informed of the risks and costs associated with trading the financial markets, carefully consider your investment objectives, level of experience, and risk appetite, and seek professional advice where needed.
Fusion Media would like to remind you that the data contained in this website is not necessarily real-time nor accurate. The data and prices on the website are not necessarily provided by any market or exchange, but may be provided by market makers, and so prices may not be accurate and may differ from the actual price at any given market, meaning prices are indicative and not appropriate for trading purposes. Fusion Media and any provider of the data contained in this website will not accept liability for any loss or damage as a result of your trading, or your reliance on the information contained within this website.
It is prohibited to use, store, reproduce, display, modify, transmit or distribute the data contained in this website without the explicit prior written permission of Fusion Media and/or the data provider. All intellectual property rights are reserved by the providers and/or the exchange providing the data contained in this website.
Fusion Media may be compensated by the advertisers that appear on the website, based on your interaction with the advertisements or advertisers.
© 2007-2024 - Fusion Media Limited. All Rights Reserved.