They say there’s safety in numbers. Indeed, most investors seem to believe as much. They continually exhibit herd behavior, swarming from one hot sector or stock to the next.
However, following the herd leads to mediocre performance at best and crippling losses at worst. We don’t want to fight the flow all of the time, but it definitely pays to think like a wolf in sheep’s clothing as we look for opportunities. And as it turns out, there’s a cunning strategy to track the movements of the investing “sheeple”…
ETF.com has an invaluable fund flow tool that lets us tally the net creations or redemptions for exchange-traded funds (ETFs) over a certain time period. I like to periodically check out which ETFs investors are flocking to or dumping en masse.
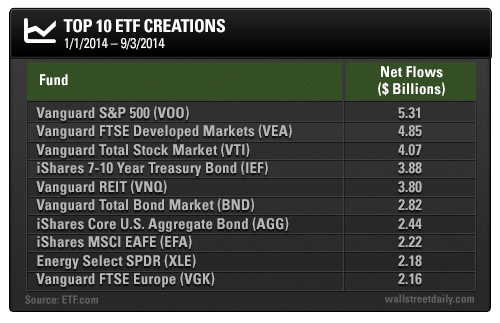
Below is a list of the top 10 ETF creations year to date:

As you can see, Vanguard is en fuego, with six of the top 10 ETF creations in 2014 belonging to the fund Goliath. These inflows underscore the popularity of index investing at the moment.
It’s also interesting to see inflows for the iShares 7-10 Year Treasury Bond ETF (ARCA:IEF). Naturally, as Treasuries rise (yields fall), more ETF investors will be joining the party.
However, I’ve discussed why investors should stick to holding the underlying Treasury Notes and not hold them in ETF form. Those who bought the particular T-Note I talked about in March are sitting on a total gain of 4.4% and are now holding bonds that have around five fewer months to maturity (less risk).
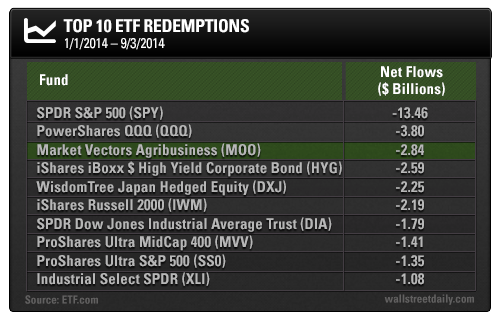
Now, let’s look at the ETF redemptions:

To me, the outflows from the Market Vectors Agribusiness (NYSE:MOO) really stand out.
This ETF (with a unique and memorable ticker) holds companies that produce agrichemicals, fertilizers, seeds, farm machinery, or other agricultural-related products.
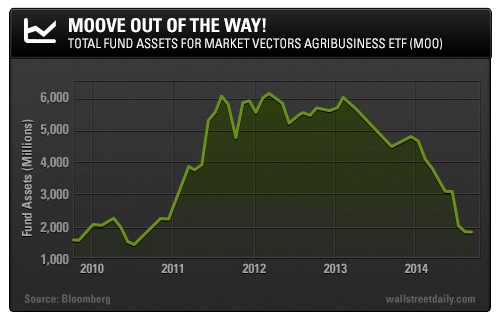
As you can see from the chart below, MOO was extremely popular in 2011, when many agricultural commodities were reaching multi-year highs. Total fund assets reached $6 billion by mid-2011.

Huge numbers of investors were buying into agribusiness by then… but unfortunately, the herd was wrong at the worst possible time.
Consider: Since July 2011, the S&P 500 has produced a total return of around 60%. MOO has underperformed badly and is only up around 5% over the same time period.
This is yet another example of how following the herd is not a viable strategy even if, by definition, it’s what most people do. Instead, we should watch what the herd is doing, and blaze our own path.
Today, with Corn and Wheat prices at multi-year lows, the herd has now stampeded out of MOO. This exodus should pique our interest, as there may be an opportunity to look for value in an unloved industry.
Next week, I’ll dig into MOO’s holdings to see if there are any hidden agribusiness gems with solid dividends that warrant our attention.
