When I initiated the dshort web page in late 2005, one of my routine topics was equity valuations, initially inspired by Nobel laureate Robert Shiller's book, Irrational Exuberance, the second edition of which was published earlier that year. I gradually expanded my focus from his cyclically adjusted price-to-earnings ratio (CAPE) to include Ed Easterling's Crestmont P/E, Nobel laureate James Tobin's Q Ratio and my own monthly regression analysis of the S&P 500.
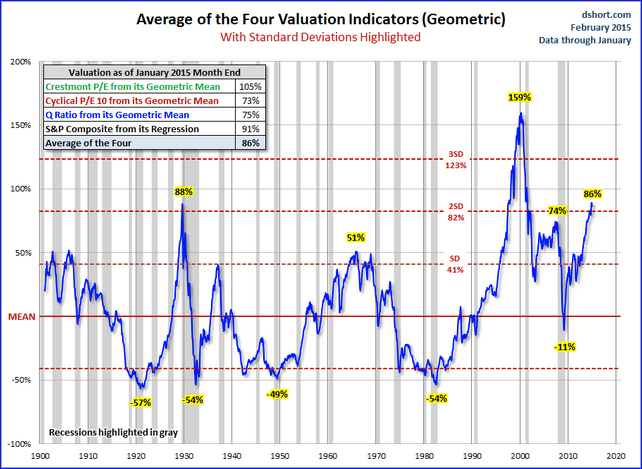
About three years ago I began posting a monthly update featuring an overlay of the four. Here is a chart that shows the average of the four valuation indicators from a mean regression.

Last week I had a fascinating conversation with Neile Wolfe, of Wells Fargo Advisors (NYSE:WFC). Based on the underlying data in the chart above, Neile made some cogent observations about the historical relationships between equity valuations, recessions and market prices:
- High valuations lead to large stock market declines during recessions.
- During secular bull markets, modest overvaluation does not produce large stock market declines.
- During secular bear markets, modest overvaluation still produces large stock market declines.
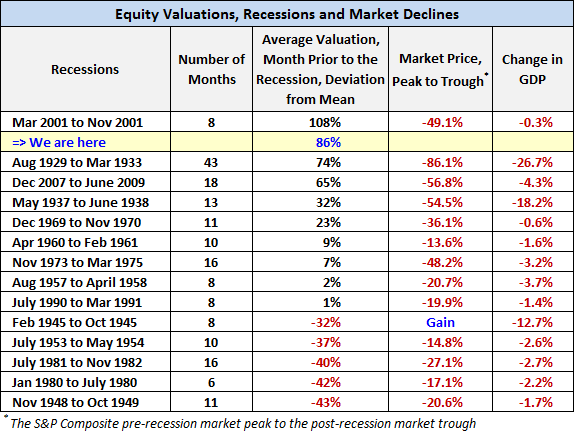
Here is a table that highlights some of the key points. The rows are sorted by the valuation column.

Beginning with the market peak before the epic Crash of 1929, there have been fourteen recessions as defined by the National Bureau of Economic Research (NBER). The table above lists the recessions, the recession lengths, the valuation (as documented in the chart illustration above), the peak-to-trough changes in market price and GDP. The market price is based on the S&P Composite, an academic splicing of the S&P 500, which dates from 1957 and the S&P 90 for the earlier years (more on that splice here).
I've included a row for our current valuation, through the end of January, to assist us in making an assessment of potential risk of a near-term recession. The valuation that preceded the Tech Bubble tops the list and was associated with a 49.1% decline in the S&P 500. The largest decline, of course, was associated with the 43-month recession that began in 1929. Note: Our current market valuation puts us between the two.
Here's an interesting calculation not included in the table: Of the nine market declines associated with recessions that started with valuations above the mean, the average decline was -42.8%. Of the four declines that began with valuations below the mean, the average was -19.9% (and that doesn't factor in the 1945 outlier recession associated with a market gain).
What are the Implications of Overvaluation for Portfolio Management?
Neile and I discussed his thoughts on the data in this table with respect to portfolio management. I came away with some key implications:
- The S&P 500 is likely to decline severely during the next recession, and future index returns over the next 7 to 10 years are likely to be low.
- Given this scenario, over the next 7 to 10 years a buy and hold strategy may not meet the return assumptions that many investors have for their portfolio.
- Asset allocation in general and tactical asset allocation specifically are going to be THE important determinant of portfolio return during this time frame. Just buying and holding the S&P 500 is likely be disappointing.
- Some market commentators argue that high long-term valuations (e.g., Shiller's CAPE) no longer matter because accounting standards have changed and the stock market is still going up. However, the impact of elevated valuations -- when it really matters -- is expressed when the business cycle peaks and the next recession rolls around. Elevated valuations do not take a toll on portfolios so long as the economy is in expansion.
How Long Can Periods of Overvaluations Last?
Equity markets can stay at lofty valuation levels for a very long time. Consider the chart posted above. There are 1369 months in the series with only 58 months of valuations more than two Standard Deviations (STD) above the mean. They are:
- September 1929 (i.e., only one month above 2 STDs prior to the Crash of 1929)
- Fifty-one months during the Tech bubble (that's over FOUR YEARS)
- Six of the last seven months have been above 2 STDs
Stay tuned. Next week I'll be updating the four valuation indicators I routinely track, and preliminary indications are that February will be another month of valution above 2 STDs.
