The bulls waiting for that elusive equity market bounce. The wait was short as the market snap back over the last two days qualifies as that bounce. Investors are likely contemplating the market's direction from here.
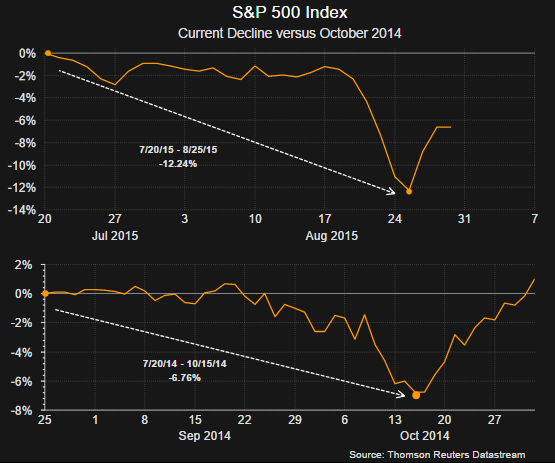
A "V-type" pattern seems to be forming just as the market traced out late last year. As the below chart shows, the contraction from July to October of 2014 was not as severe as the one being experienced at the moment and took longer to develop. What is interesting is that the pace of this bounce back seems to be occurring just as quickly as the one last year. 
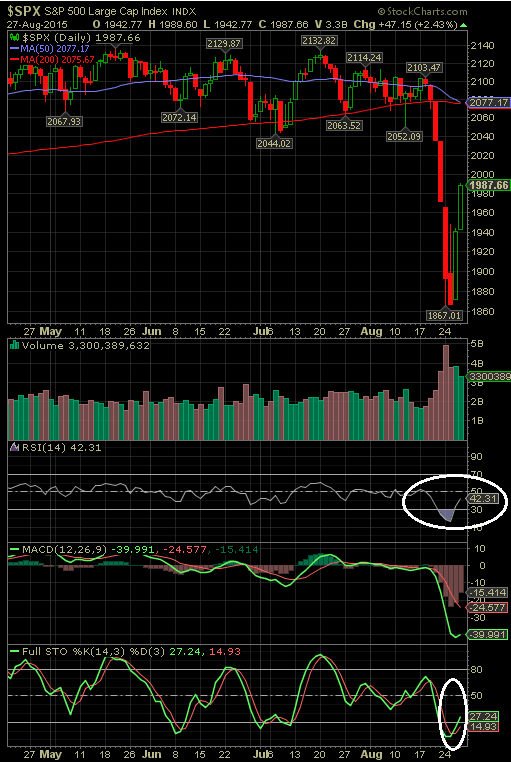
In the post on Tuesday the article noted the extreme low for the relative strength index (RSI) which was reported at 16.77. At today's close the RSI improved to 42.31 and at this level, historically, further strength has occurred as can be viewed in the below chart. 
Lastly, one market factor investors must deal with today is the increased influence of algorithmic trading and indexing. As a result, in order for programs to trade the market, these programs must evaluate certain technical market patterns and trading these patterns can be a self-fulfilling prophecy. Nonetheless, it is important for investors to review these patterns. The difficulty for fundamental investors is fundamentally strong companies may not perform as expected in the short run if the "technicals" are not bullish. One author that does a good job pointing out these various technical patterns on a daily basis is Charles Kirk of The Kirk Report (minimal subscription required.) His daily market summaries and weekly chart shows are important materials to review for investors wanting insight into the technical aspects of the market and individual stocks/ETFs.
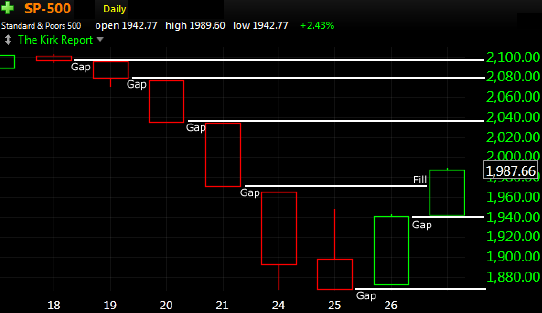
In his report tonight, he notes the "gaps" in the market that have developed due to the market's recent decline. These gaps can serve as magnets for the market indexes as programs try to trade towards them. These gaps can be seen in the below chart and he notes, "Every major stock market in the world surged higher today and the gaps created by Monday’s down open have been filled." Do these additional gaps get filled? 
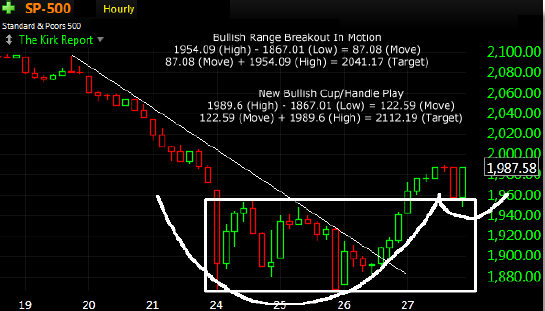
Another chart provided in Charles' report was the one below noting the bullish cup and handle set up for the S&P 500 Index.
Some of the commentary included with the above chart notes,
"From a technical perspective, we have two bullish developments. First, today’s upside following through has triggered a bullish range breakout setup with a S&P 2041 target which is interesting because that the same area of prior range support now key overhead resistance. Second, with this afternoon’s throwback retest of the range, a secondary bullish cup/handle formation has also formed and if it triggers, that would provide a target at 2112."
This market is unlikely to move higher from here without some pullbacks. There are certainly issues the market needs to digest in the coming months, the Fed's rate decision in September, a seasonally weak market period for the next two months, just to name a few items. On the positive side though the technicals are improving and it does seem investors have cash to put to work. Today Lipper reported investors pulled $17.8 billion from equity funds for the week ending 8/26/2015 (this is buying cash) and the revised reading on GDP today was positive and supports a continued bump along economic growth environment.

