Continental (DE:CONG):
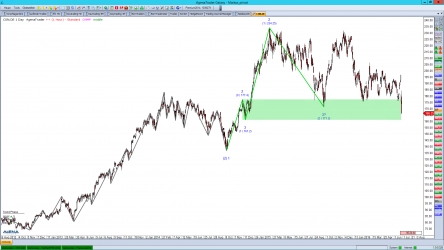
The leading international tire manufacturer, Continental, is suffering under the Brexit decision just as much as many other values are too. However, this value has been in a corrective downtrend for some time now.
Nevertheless, in the chart we can still see a large uptrend, whose lower end of the correction zone is where the price is currently located. This trend is still young enough to be able to push onwards.
To do so, however, it must not leave the correction zone downwards by means of a closing price. It will be interesting to see whether there are enough buyers for this. If this should be the case, an excellent long chance will be available.
Viacom (NASDAQ:VIAB):
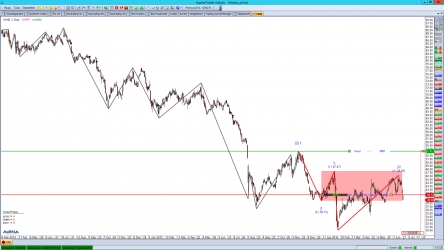
The global entertainment company Viacom is also having to adapt to the generally bad stock exchange environment, and has been in a large downtrend for a very long time now. The last low dates back to February 10th, and is located at $30.11.
The value has been able to move into its last correction zone since that low – by means of a subordinate trend – but has been showing clear signs of weakness for several days now. This means that we can expect this trend to continue on downwards once again.
Fresenius Medical (DE:FMEG):
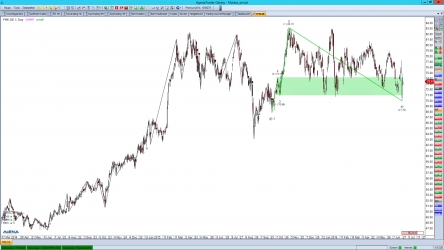
Fresenius Medical Care is a leading worldwide provider of products and services for dialysis technology, a treatment of chronic kidney failure. The current trend itself almost failed in the small trend size, since the green correction zone could only narrowly be defended.
As long as we do not see a closing price beneath this zone, the trend can continue again. In this case, a good entry chance is currently available.
Twitter (NYSE:TWTR):
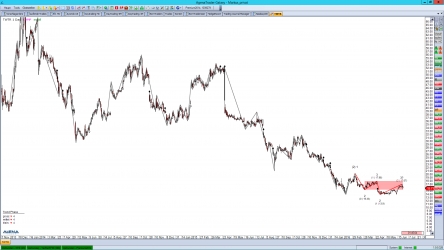
The short message service Twitter has also seen better days. Since its high in December 2013 at around $75, the price has generally only known one direction, and that was pointing towards the south. Interim recoveries were sold off again after some time. The last low from May 2016 is located at $13.90; the correction zone reaches from $15.33 up to $17.98 on the upper side.
The current correction led the price to $17.07, and now the trend seems to want to continue on downwards. With this, there is a nice short chance in the trend direction. Since the superior trend has already gone very far, however, the first target should be located right at the last low.
Disclaimer: Exchange transactions are associated with significant risks. Those who trade on the financial and commodity markets must familiarize themselves with these risks. Possible analyses, techniques and methods presented here are not an invitation to trade on the financial and commodity markets. They serve only for illustration, further education, and information purposes, and do not constitute investment advice or personal recommendations in any way. They are intended only to facilitate the customer's investment decision, and do not replace the advice of an investor or specific investment advice. The customer trades completely at his or her own risk.


