The global economy has been showing a bit of resilience as of late, with the manufacturing index recovering back toward 50.2 in December from 49.6 in November. Stabilisation is seen in U.S. and China at present, while the Euro zone and Japan continue to deteriorate. However, the question is weather or not the 2011/12 economic soft patch is a bottom from which another expansion period will start?
Chart 1: Recovery in global manufacturing, but for how long?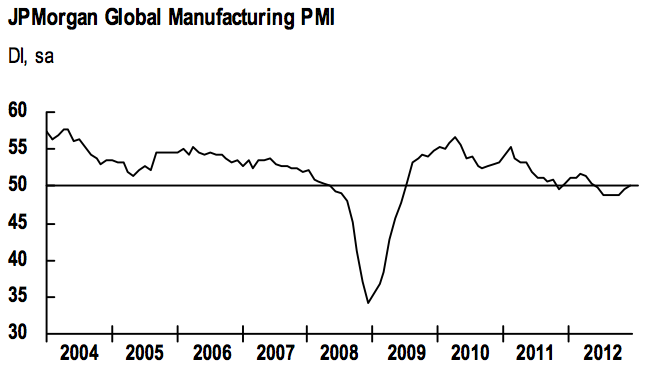
Personally, I highly doubt it. When I watch Bloomberg or CNBC, I get the impression from various analysts, strategists and traders that this is a great time to buy into investment cycle. In my view, many market participants fail in understanding how to read the business cycles, as they are usually focused on short term trading and news headlines.
Chart 2: Global investors view the economy in a late cycle with 12% seeing a recession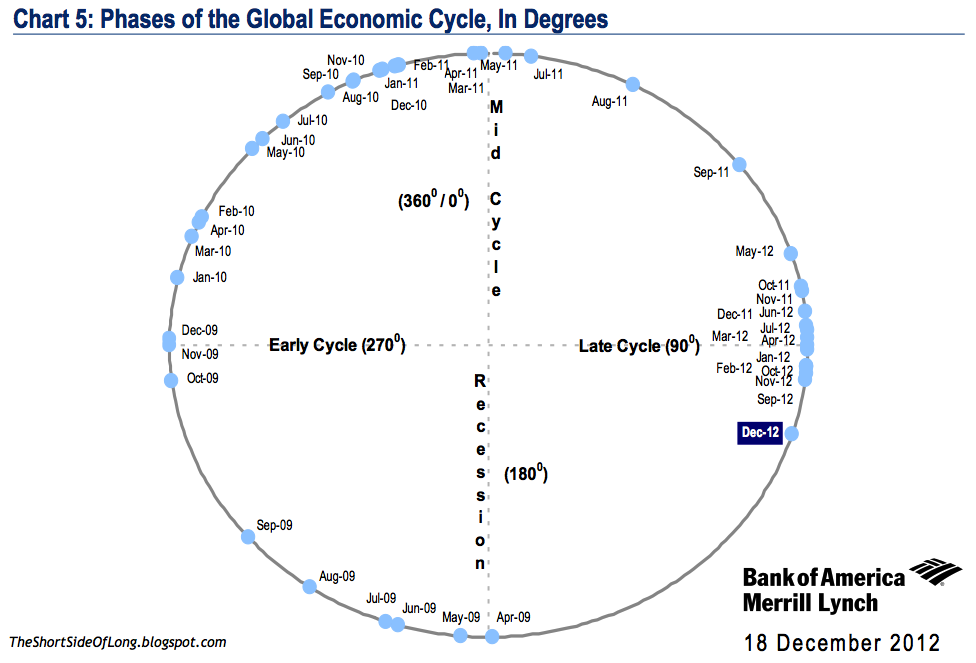
My personal view is that the current business expansion, as well as the investment cycle (bull market), both started in March 2009. As we approach the four year anniversary in March 2013, the bull market will be in very late stages of the investment cycle.
Chart 3: The four year old bull market has returned 120% from its lows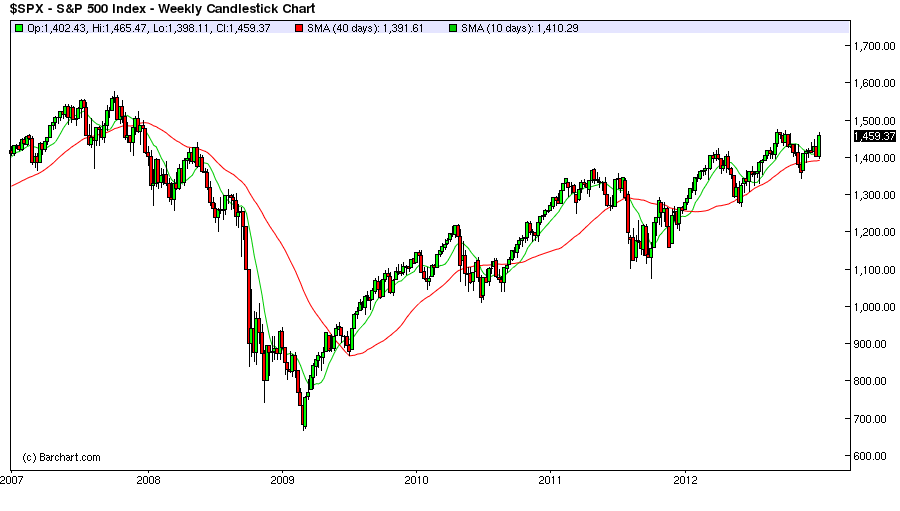
With the return of over 120% from its March 2009 lows, this has been one of the strongest rallies in the stock market post World War II era. Other higher beta indices have enjoyed similar or even more of a speculator runs. Consider that the German DAX is up 111%, Singapore's STI is up 113%, Mexican Bolsa is up 160%, Nasdaq 100 is up 168%, U.S. Industrial sector is up 174%, US Discretionary sector is up 216%, Philippines Composite is up 236%, Thailand's SETI is up almost 260% and so on.
Investors seem to be in disagreement on weather or not the S&P 500 September high at 1474 is a top, but in my opinion this is irrelevant. The point is that the majority of the gains in the current bull market are most likely realised, especially in the earlier parts of the expansion from early '09 to early '11. Technically, we are approaching an enormous resistance area between 1450 to 1550.
Chart 4: Bull market leaders like Apple have most likely topped out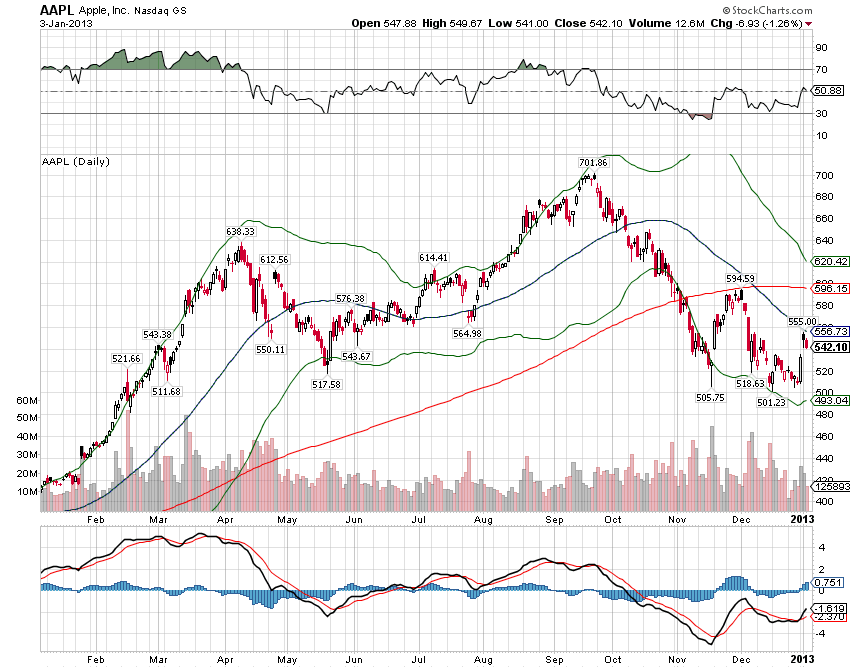
Furthermore, it seems more and more likely that bull market leaders and investor darlings like Apple have now topped out. Apple has managed to gift investors an impressive gain of eight times return since the March 09 lows and even more impressively, a return of 110 times since the March 2003 low. If the top is now in place for this speculative stock, it could most likely mark the beginning of the end when it comes to the business cycle.
Chart 5: Risk taking appetite and greed have prevailed since August 2012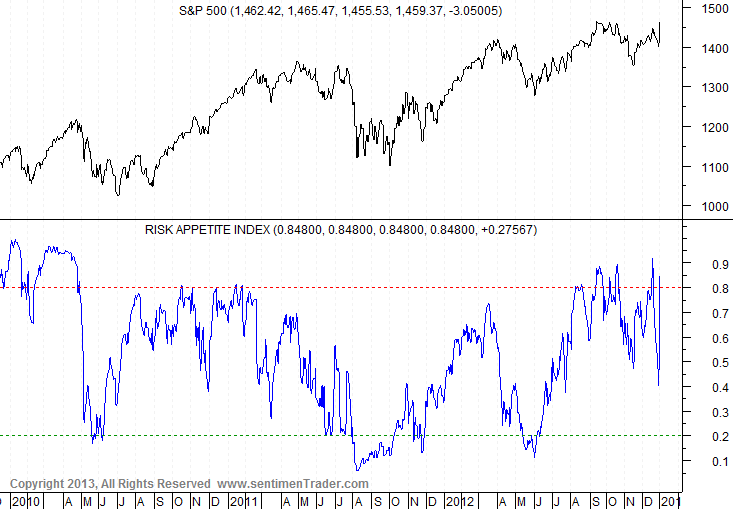
I understand that majority of the investors do not agree with my views. After all, they point to the recent price action of several percentage points and automatically make conclusions based on emotions. In markets, success is usually achieved when one is almost alone against majority. The chart above shows that majority of investors have been consistently hungry towards risk as they chase equities and other risk assets since August 2012. However, overwhelming bullishness held by the herd is not reflected in the gains. Consider that over five months, since risk appetite indicator became extreme, S&P 500 has managed to gain only 4.5% at best.
Chart 6: After four years of rapid expanding, corporate profits could disappoint in 2013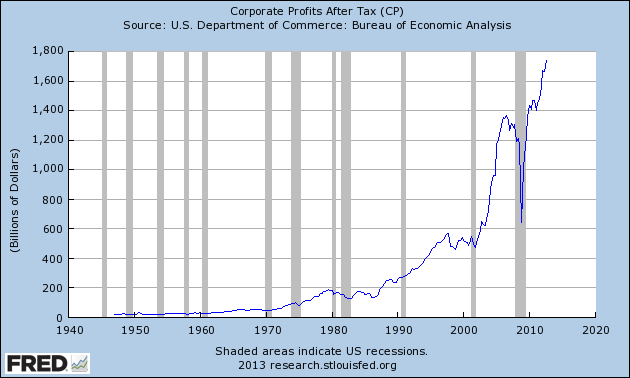
I am also of the opinion that this overly bullish condition will not last forever, especially as margin squeeze and earnings disappointments could sneak up on investors, as they deteriorate in coming quarters.
Chart 7: Corporate insiders are currently extremely negative on the U.S. stock market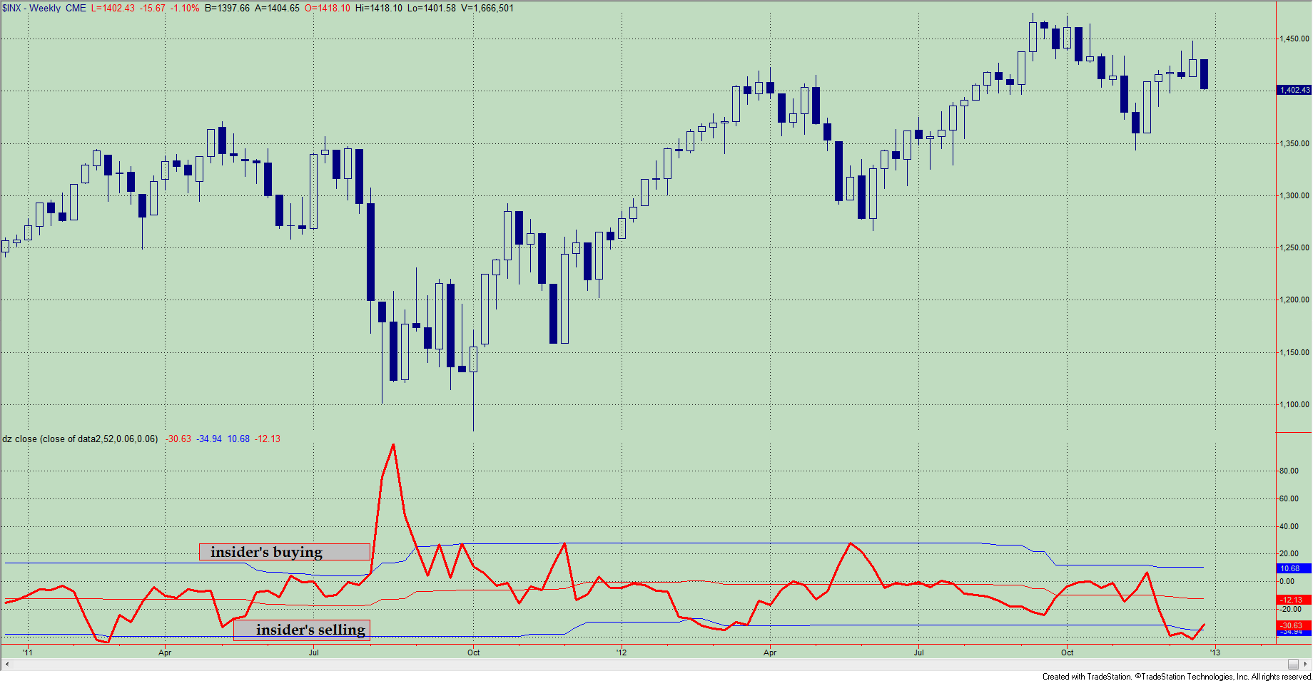
It seems that corporate insiders, whose knowledge on corporate earnings is always far better than the rest of the Wall Street strategists, are currently extremely bearish on stocks. If the Fiscal Cliff issues are solved and the economy is in "such a good shape", I ask myself why would insiders be such strong sellers right now? The answer most likely links to deteriorating business conditions.
In summary, I do not see equities as an attractive long term investment right now. If you have been following the blog for awhile, you should also know that I have sold short some U.S. equity sectors, between late July and early September, with a view of lower prices into 2013/14 period. While majority of these positions have not performed at present, as the bull market continues its topping process, I hold a very high conviction that in due time the financial markets are headed for another crisis, equities in the U.S. are heading toward another cyclical bear market and the economy is headed toward another recession.
Note: Over the coming days, I will cover currencies, commodities, precious metals and bonds.
Trading Diary (Last update 09th of December 12)
- Economic Outlook: The global economy continues to slow towards a recession, as we find ourselves in the very late cycle of the expansion. United States growth is anaemic, while the Eurozone and Japan are in a recession. German CEOs see the business cycle moving deeper into a downturn with a high probability of a recession, with Japanese business confidence continuing to shrink. Chinese growth remains slow, with a massive credit bubble lingering in the background. Most likely, a hard landing will not be avoided.
- Equities: Short positions are held in various US equity sectors, which include Dow Transports (IYT), Technology (XLK), Discretionary (XLY) and Industrials (XLI). Large put options have been bought on Apple (AAPL). Call options have been sold on Homebuilders (XHB), JP Morgan (JPM), Amazon (AMZN), IBM (IMB), Commonwealth Bank (CBA), Adidas (ADS) and others.
- Bonds: There isn't a lot of exposure in the bond space, as we believe this sector is experiencing euphoric investor demand. Call options have been sold on Junk Bonds (HYG). Plans to short Long Bond Treasuries (TLT) in due time.
- Currencies: Long positions are held in Japanese Yen (FXY). Short positions are held in Australian Dollar (FXA). The trade is now essentially short Aussie / Yen cross. Put options have been bought on British Pound (FXB) & Canadian Dollar (FXC). Put options have been sold on Japanese Yen (FXY).
- Commodities: Long positions are held in various commodity sectors, which include Silver (SLV, SIVR, PSLV, Comex futures), Agriculture (RJA, JJA) and Sugar (SGG). Plans to increase longs in PMs and Softs in due time.
