Forex News and Events
End of low volatility period
After a very quiet month of August, the volatility is slowing ticking up across financial markets with investors starting to question whether the current levels of the equity market are sustainable against the backdrop of subdued global growth outlook. After hitting 11% in early August, the VIX increased marginally over the month to return at around 12.50%, which is still a low level in comparison to the 27% reached in the wake of the Brexit referendum.
In the FX market, the volatility has been flirting with record low for most of the summer; however with traders returning from vacation and expectations for Fed tightening building again, the risk measures ticked up. EUR/USD 1-week ATM implied volatility increased to 7.6% from below 6% on August 15. USD/JPY 1-month ATM implied volatility soared to 15% this morning as traders anticipated the BoJ will act to prevent further JPY appreciation at its next monetary policy meeting in late September. Given the recent very low levels of volatility, it can only increase now.
GBP keeps on strengthening
Over the past five days, the pound has appreciated against the dollar and the pound. The cable is targeting $1.32 while the euro is trading lower towards £0.85. Financial markets have clearly priced in a strong devaluation of the pound on the wake of the Brexit vote. We now think that there has some room for further improvement of the UK Currency and that markets start to realize it.
Recent UK data did not come in as soft as it was expected by markets. Tourism is increasing due to the current pound weakness. The unemployment benefits have also declined, the unemployment rate is at its lowest level since 2005 at 4.9% and even if consumer confidence has dropped, this does not really reflect in the economy. Indeed retail sales jumped 5.9% y/y in July. On top of that UK stocks are on the rise. This last point must nonetheless be qualified as the BoE is massively injecting liquidities.
What we do know for sure two months after the 23rd of June referendum is that investments have not sharply declined as it was promised. The fear of the Brexit consequences has generated some outflows but this remains somewhat limited.
If UK is better off without the EU, there is no reason why other countries should not ask to leave or at least ask for specific conditions within the EU. The truth is that elites are very reluctant to give that possibility to their people. For example there is no way such a referendum would take place in France. To conclude, it must also be said that the UK has not left yet. UK new Prime Minister Theresa May is already postponing the triggering of the article 50 that will start the exit process. Finally this is maybe what is still weighing on the pound.

The Risk Today
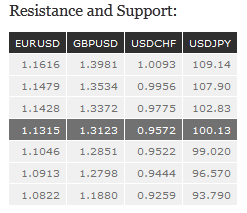
EUR/USD has reversed buying pressure to move near the low of its rising channel, yet uptrend remains strong. Key resistance is given at 1.1355 (23/08/2016 high) then 1.1428 (23/06/2016 high). Hourly support can be found at 1.1286 (rising channel). Expected to increase again. In the longer term, the technical structure favours a very long-term bearish bias as long as resistance at 1.1714 (24/08/2015 high) holds. The pair is trading in range since the start of 2015. Strong support is given at 1.0458 (16/03/2015 low). However, the current technical structure since last December implies a gradual increase.
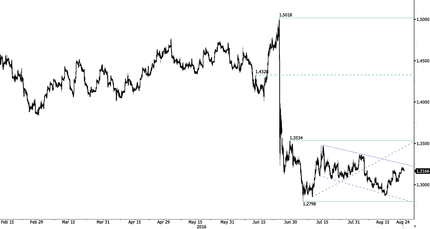
GBP/USD momentum has stalled near the key declining channel top. Yet, the medium-term bearish momentum is lively. Hourly resistance can be found at 1.3372 (03/08/2016 high). Hourly support can be found at 1.3024 (19/08/2016 low). The long-term technical pattern is even more negative since the Brexit vote has paved the way for further decline. Long-term support given at 1.0520 (01/03/85) represents a decent target. Long-term resistance is given at 1.5018 (24/06/2015) and would indicate a long-term reversal in the negative trend. Yet, it is very unlikely at the moment.
USD/JPY is bouncing around the 100-mark. The technical structure suggests that the pair is gaining momentum to head further lower. Strong support given at 99.02 (24/06/2016 low). Hourly resistance is given at 102.83 (02/08/2016 high). Selling pressures should continue.We favour a long-term bearish bias. Support is now given at 96.57 (10/08/2013 low). A gradual rise towards the major resistance at 135.15 (01/02/2002 high) seems absolutely unlikely. Expected to decline further support at 93.79 (13/06/2013 low).
USD/CHF has seen a pickup in short-term buying interest near the hourly support at 0.9600(23/08/2016low). Hourly support given at 0.9522 (23/06/2016 low) is on target. Hourly resistance can be found at 0.9659 (09/08/2016 high). In the long-term, the pair is still trading in range since 2011 despite some turmoil when the SNB unpegged the CHF. Key support can be found 0.8986(30/01/2015 low). The technical structure favours nonetheless a long term bullish bias since the unpeg in January 2015.

