Two month ago, we speculated that the end of the Fed’s Quantitative Easing program could hurt emerging market economies and currencies. In our view, the so-called “Fragile Five” economies (Brazil, Turkey, South Africa, India, and Indonesia) looked particularly vulnerable, but a number of developments over the past week have partially alleviated those concerns.
Though the Fed has completely tapered QE and is now considering raising interest rates sometime next year, other central banks have ratcheted up their liquidity at the same time. Just in the past two weeks, the Bank of Japan dramatically increased its QQE program and pushed back a sales tax hike, the People’s Bank of China surprised traders by cutting both its one-year lending and savings rates, and ECB President Draghi has heavily hinted at a sovereign QE program in the Eurozone in the near future. Undoubtedly, this next wave of global liquidity will have a massive impact on the domestic currencies in question, but it could also spill over to help support the previously vulnerable Fragile Five currencies as well.
USD/TRY: Consolidation Set to Continue This Week
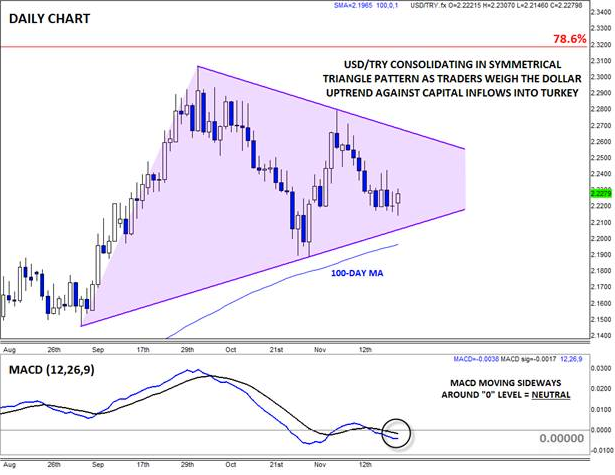
Based on the recent price action, the Turkish lira is already holding its own against the broad-based US dollar rally. For the past three months, USD/TRY has been consolidating in a symmetriacl triangle pattern between 2.15 and 2.30. With little economic data on the calendar for the eastern European country this week (Friday’s foreign trade data is the only noteworthy release), more consolidation within the triangle is favored this week. That said, if the US dollar uptrend sputters later this year, USD/TRY could drop below support at the bottom of its symmetrical triangle and the 100-day MA near 2.20 to expose longer-term Fibonacci retracement support at 2.1550 next.

Source: FOREX.com
USD/ZAR: Testing Key Support with Data Heavy Week On Tap
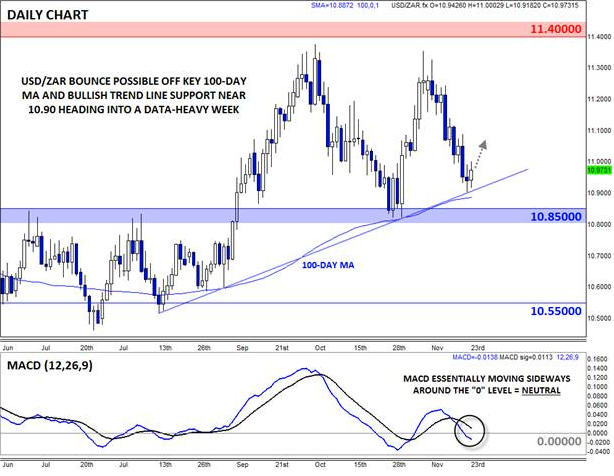
In many ways, the chart of USD/ZAR is very similar to USD/TRY. The EM currency, perhaps boosted by the loose global monetary policy noted above, has kept pace with the dollar over the last two months. Over that period, USD/ZAR has carved out a range from previous-resistance-turned-support at 10.85 up to the 6-year high at 11.40. As we go to press, the pair is bouncing from trend line / 100-day MA support in the 10.90 area, suggesting we could see a bit of dollar strength this week.
Unlike USD/TRY though, USD/ZAR will face a series of high-impact economic reports this week, including GDP and Business Confidence tomorrow, Producer Prices on Thursday, and Credit, Trade balance, and Fiscal Balance data on Friday. USD/ZAR traders may be in a for a rollercoaster ride of a week, depending on how these reports come out, but the overall bias will remain to the topside above support in the 10.85-10.90 area.

Source: FOREX.com
For more intraday analysis and market updates, follow us on twitter (@MWellerFX and @FOREXcom).
