The Economic Cycle Research Institute (ECRI) has been bearish on the US economy since making its recession call in late 2011. This week, ECRI published a presentation reaffirming its bearish outlook. We have reprinted an excerpt from the latest analysis below and you can read the document in its entirety here.
It is now well known from the Reinhart and Rogoff work that, following financial crises, economies tend to experience unusually weak growth. But what this pattern suggested, even before the financial crisis, is that we were set to see a weak economic recovery, in any case. Because the weakness of the revival from the Great Recession is almost universally blamed on the financial crisis, there is a broad consensus that the economy will return to much stronger trend growth after the deleveraging phase ends. But the implication of “the yo-yo years” thesis is that there is no clear reason for this longer-term pattern of weak growth to go away, even when deleveraging does come to an end. Indeed, the current evidence suggests that we are already in the yo-yo years for the U.S. and most other major developed economies.
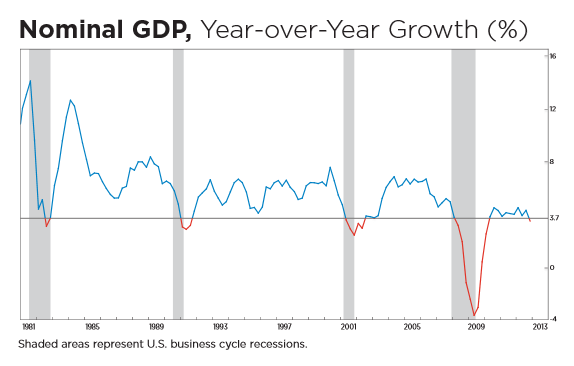
It was against this backdrop, in late September 2011, that ECRI made a recession call. A couple of months later, in December 2011, we clarified our view of the likely recession timing, saying that we thought it would begin by mid-2012, but not be recognized before the end of 2012. We said this because, over the last six recessions, the median lag between the recession start date and the first negative real-time GDP print had been half a year. As it happened, in January 2013 there was a negative GDP print, consistent with our belief that the recession had begun around mid-2012. Here we have a chart of year-over-year nominal GDP growth which, after last week’s revision of real GDP growth from -0.1% to 0.1%, is still down to 3.5%. This chart begins in the early 1980s. Based on the full 65 years of historical data, nominal GDP growth below 3.7%, which is marked off by the horizontal line, has always occurred in a recessionary context – without exception.
This chart is consistent with a mild recession. Yet, we have all heard lots of commentary that we’re in a “2% economy” – not that great, but as long as the economy stayed above recessionary stall speed it would be okay.
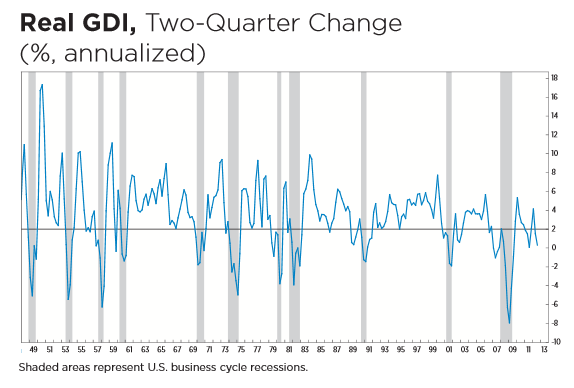
About two years ago the Federal Reserve Board published a study that investigated various stall-speed measures, including GDP and Gross Domestic Income (GDI), which should theoretically be identical to GDP but for the statistical discrepancy. The Fed study concluded that the best stall-speed measure may be the two-quarter annualized growth rate of real GDI, and when that measure fell below 2% it was a recession signal, because the economy would stall out.
Here is a historical chart of the two-quarter annualized percent change in GDI, with a horizontal line placed at the Fed’s 2% stall- speed threshold. You can see why they believe that historically that has been a fairly reliable recession signal, because it has never dropped clearly below that threshold without there being a recession. It is not unusual to see this measure drop below the 2% stall speed, pop up briefly, and then fall back as recession begins. So where were we in 2012?
All the way to the right of this 65-year chart we see this measure decline in the second quarter of 2012 to 1.5%, below the stall-speed threshold. And in the third quarter of 2012 it dropped further to 0.4%. So by last summer it had already spent two quarters below stall speed. You may recall that in the run-up to last fall’s election, the jobless rate was falling so rapidly that some even questioned how real the decline was. But in light of the Fed’s stall-speed measure, their pledge last year of ongoing quantitative easing makes more sense.
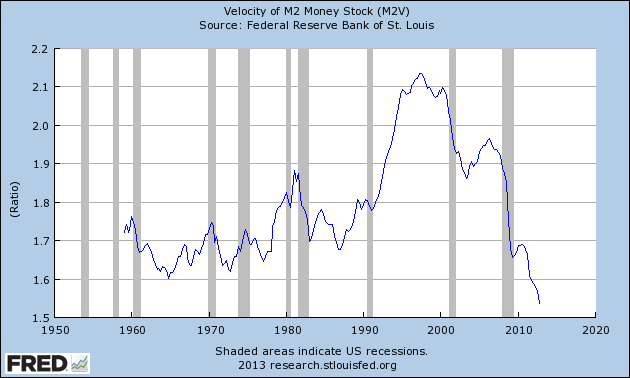
The report also observes that the velocity of M2 money supply has plunged to the lowest level ever recorded (although it should be noted that the Federal Reserve database does not include data from the Great Depression of the 1930s and 1940s).
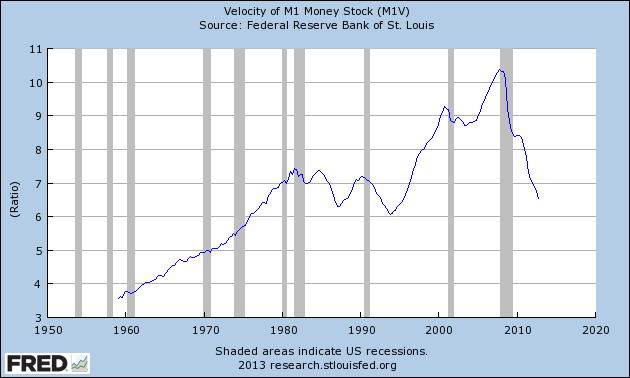
We have been monitoring the downtrend in M1 money supply during the last four years and it continues to decline sharply as well.
Essentially, velocity measures how fast money changes hands, providing a gauge of economic activity. In basic terms, when velocity declines sharply even as supply is being introduced at an unprecedented rate, the implication is that the added liquidity is not engendering economic activity. This is what “pushing on a string” looks like. The Federal Reserve can attempt to spur economic activity by introducing monetary stimulus, but it cannot force banks to increase their loan and investment activity.
As it has for the past several years, the big picture suggests that our economy remains structurally unsound. Until we take steps to meaningfully address the underlying problems such as excessive debt and stop focusing on short-term fixes designed to provide superficial relief, the economy will continue to struggle.
- English (UK)
- English (India)
- English (Canada)
- English (Australia)
- English (South Africa)
- English (Philippines)
- English (Nigeria)
- Deutsch
- Español (España)
- Español (México)
- Français
- Italiano
- Nederlands
- Português (Portugal)
- Polski
- Português (Brasil)
- Русский
- Türkçe
- العربية
- Ελληνικά
- Svenska
- Suomi
- עברית
- 日本語
- 한국어
- 简体中文
- 繁體中文
- Bahasa Indonesia
- Bahasa Melayu
- ไทย
- Tiếng Việt
- हिंदी
ECRI Remains Bearish on Economy
Published 03/07/2013, 01:39 AM
Updated 07/09/2023, 06:31 AM
ECRI Remains Bearish on Economy
3rd party Ad. Not an offer or recommendation by Investing.com. See disclosure here or
remove ads
.
Latest comments
Install Our App
Risk Disclosure: Trading in financial instruments and/or cryptocurrencies involves high risks including the risk of losing some, or all, of your investment amount, and may not be suitable for all investors. Prices of cryptocurrencies are extremely volatile and may be affected by external factors such as financial, regulatory or political events. Trading on margin increases the financial risks.
Before deciding to trade in financial instrument or cryptocurrencies you should be fully informed of the risks and costs associated with trading the financial markets, carefully consider your investment objectives, level of experience, and risk appetite, and seek professional advice where needed.
Fusion Media would like to remind you that the data contained in this website is not necessarily real-time nor accurate. The data and prices on the website are not necessarily provided by any market or exchange, but may be provided by market makers, and so prices may not be accurate and may differ from the actual price at any given market, meaning prices are indicative and not appropriate for trading purposes. Fusion Media and any provider of the data contained in this website will not accept liability for any loss or damage as a result of your trading, or your reliance on the information contained within this website.
It is prohibited to use, store, reproduce, display, modify, transmit or distribute the data contained in this website without the explicit prior written permission of Fusion Media and/or the data provider. All intellectual property rights are reserved by the providers and/or the exchange providing the data contained in this website.
Fusion Media may be compensated by the advertisers that appear on the website, based on your interaction with the advertisements or advertisers.
© 2007-2024 - Fusion Media Limited. All Rights Reserved.
