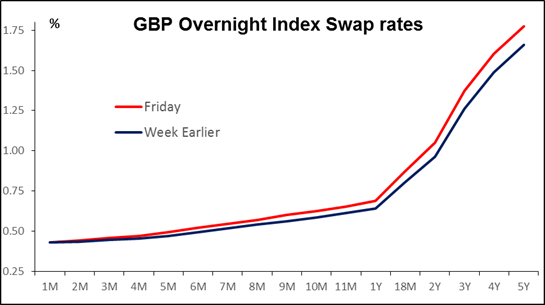
The Scottish referendum is now behind us, but its implications are still rippling through the political world. In the UK, there will be a considerable shift of power away from Parliament to Scotland and, one presumes, Wales and Northern Ireland as well. In which case, England is likely to demand a measure of self-rule, too. Over the long term, that might make the UK economy more responsive and more competitive. But in the short term, it’s likely to boost the UK Independence Party, the right-wing isolationist party that is forcing the Conservatives to become more anti-Europe. Thoughts like that may be one reason why GBP has lost most of the gains that it made following the announcement of the Scottish vote. I think the sell-off may be overdone, given the rebound in UK tightening expectations.
The effects of the Scottish referendum on the UK will only become clear over the longer term. The more immediate effect is on Catalonia and Spain. The day after Scotland voted, the Catalonian Parliament overwhelmingly approved a measure to give their president the power to schedule a non-binding vote on independence, which he reportedly will do in the next few days. The vote, if it takes place, is widely expected on Nov. 9th. Spain’s Constitutional Court has said it will immediately review the matter. If, as expected, it finds the referendum to be unconstitutional, it has the authority to suspend the vote. That’s when the drama would begin. This is a possible EUR-negative that we have to be aware of. Unlike Scotland, which accounts for less than 10% of the UK GDP, Catalonia is arguably Spain’s richest region, highly industrialized and contributes nearly 20% of the country’s tax revenue.
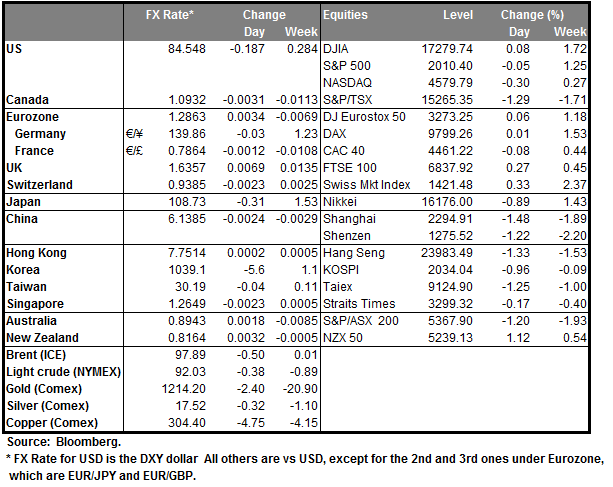
Elsewhere, the focus is once again on central banks after last week’s updated forecasts from the FOMC. With the US in the fore on the tightening schedule, I would expect the dollar to remain well bid. The market is likely to follow the lead of US interest rates and the Fed funds futures. Canada also seems to be moving more towards the tightening camp as well, especially after Friday’s announcement that core inflation jumped to 2.1% yoy in August. NOK too is likely to be underpinned. As for the shorts, those currencies where the central bank is nowhere near tightening seem likely to decline, in my view. EUR comes to mind first as investors question whether the ECB can keep to its current schedule or whether it may have to accelerate its easing program. SEK and AUD are next. As for EM, it used to be that a stronger US economy and higher interest rates were good for emerging market currencies, but now that the global economy is less synchronized, they just mean higher funding costs for dollar debt and less incentive for investors to put on EM carry trades. Thus the market is likely to become more selective on which EM currencies they buy and currencies such as TRY and ZAR, where the countries have not made much progress on their external accounts, may suffer.
Today’s data: During the European day, ECB President Mario Draghi gives his regular quarterly testimony to EU Parliament’s economic and monetary committee. As for the indicators, we get Eurozone’s preliminary consumer confidence for September.
In the US, existing home sales for August are forecast to show a moderate increase, in contrast to Thursday’s weak housing data. Chicago Fed National activity index for August is also coming out.
Besides ECB President, Riksbank Deputy Governor Karolina Ekholm, ECB Executive Board member Peter Praet and New York Fed President William Dudley speak.
Rest of the week: Tuesday is September manufacturing PMI day, with China, the major Eurozone countries and the US announcing the Markit PMIs. The China and German PMIs are expected to be weaker while the US is expected to rise. This could help boost the dollar further. From France, we also get the country’s final Q2 GDP and the forecast is for an unchanged print from the preliminary figure. In Canada, retail sales for July are coming out. On Wednesday the main event will be the German Ifo survey for September. All three indices are expected to have declined, and added to the ninth consecutive declines in ZEW survey, the Ifo data could add further pressure on the common currency. In New Zealand, we get trade balance for August and the consensus is for the deficit to widen. In the US, new home sales are due out. On Thursday from Eurozone we get M3 money supply for August. From the US, we get durable goods orders for August and the forecast is for a strong turnaround from their biggest gain on record in July, to their biggest drop if the forecast is met. The US Markit service sector PMI is also coming out. Finally on Friday, Japan’s national CPI for August is released. While usually not market affecting, if weak it could give signs for further stimulus from the Bank of Japan. From the US, we have the third estimate of the GDP and core PCE deflator, both for Q2.
The Market
EUR/USD reaches a fresh 14-month low
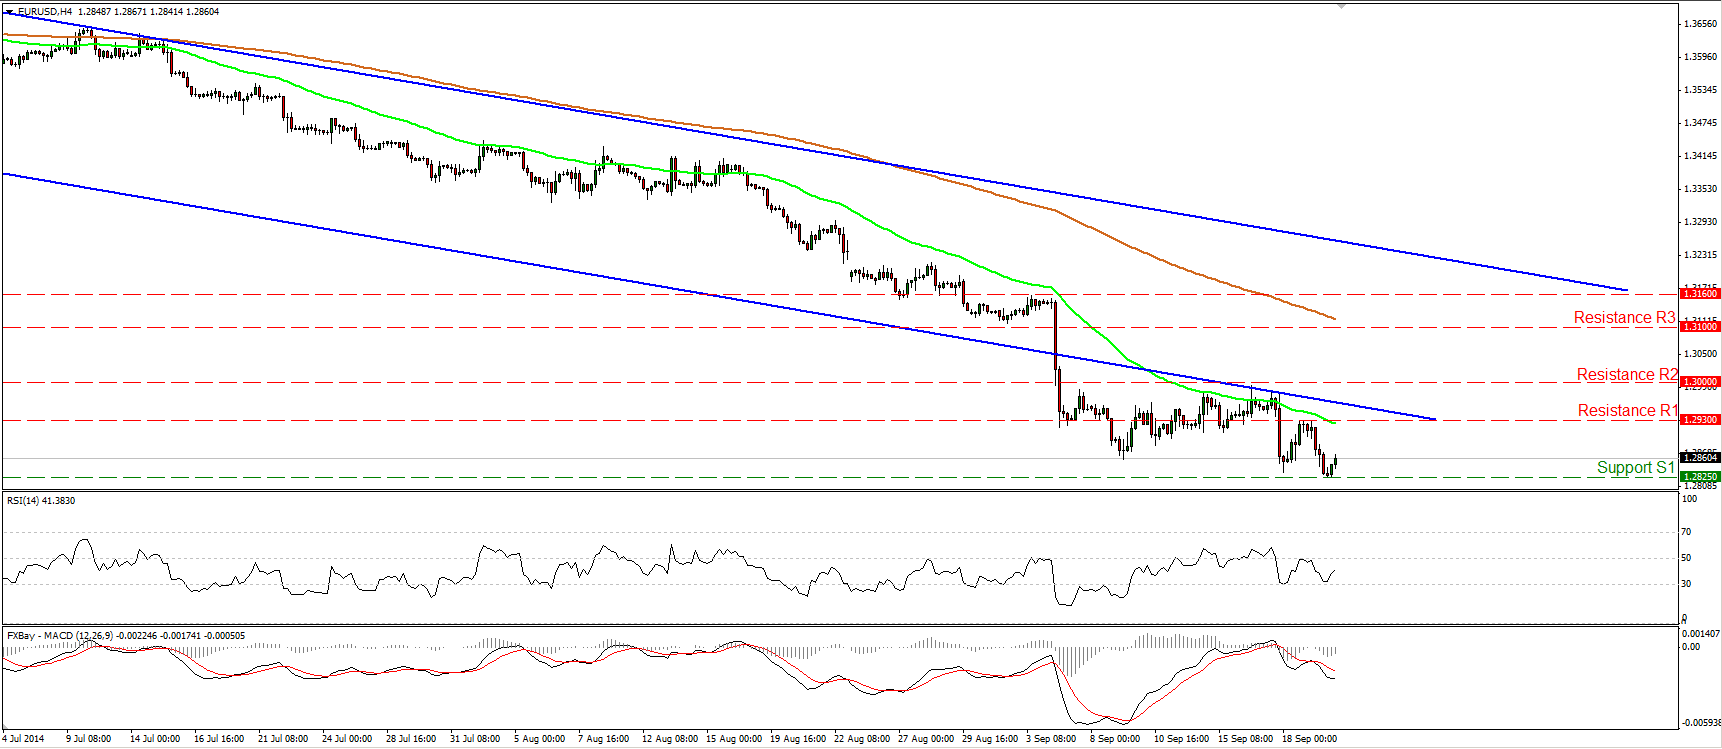
EUR/USD moved lower on Friday, but after finding support at 1.2825 (S1), the pair rebounded somewhat. Zooming on the 1-hour chart, I can see positive divergence between both our hourly momentum studies and the price action, something that makes me believe that the rebound could continue. This is also supported by our daily momentum indicators. The 14-day RSI moved higher and exited its oversold field, while the MACD crossed above its signal line. However, the price structure remains lower highs and lower lows below both the 50- and the 200-day moving averages, thus I will stick the view that the overall picture remains negative and I would see any possible bullish waves as corrective moves and renewed selling opportunities.
• Support: 1.2825 (S1), 1.2760 (S2), 1.2660 (S3).
• Resistance: 1.2930 (R1), 1.3000 (R2), 1.3100 (R3).
GBP/JPY falls after touching 180.70
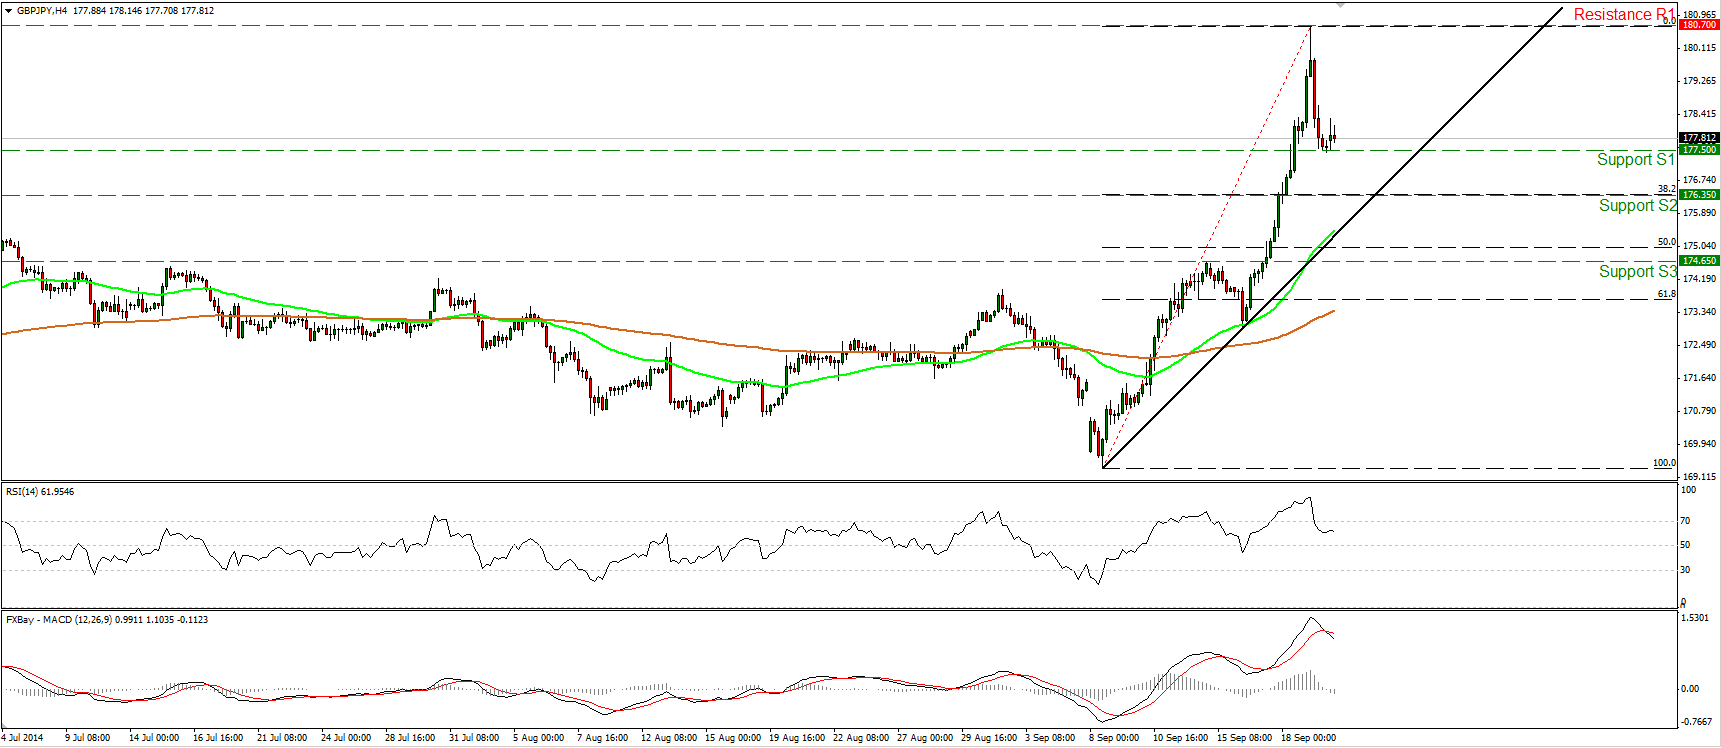
GBP/JPY fell sharply after hitting 180.70 (R1). At the time of writing, the pair is trading slightly above the support line of 177.50 (S1), but taking into account our momentum studies and the fact that I see a shooting star candle on the daily chart, I would expect the down wave to continue. The RSI moved lower after exiting its overbought territory, while the MACD has topped and moved below its trigger line. Further rate declines are likely to find support near the 176.35 (S2) line, which is the 38.2% retracement level of the 8th – 19th of September advance. However, after the upside exit of a broadening formation on the daily chart, the price structure suggests an uptrend, thus I would see any near-term pullbacks as corrective waves before buyers prevail again.
• Support: 177.50 (S1), 176.35 (S2), 174.65 (S3).
• Resistance: 180.70 (R1), 181.00 (R2), 182.00 (R3).
NZD/USD rebounds from 0.8080
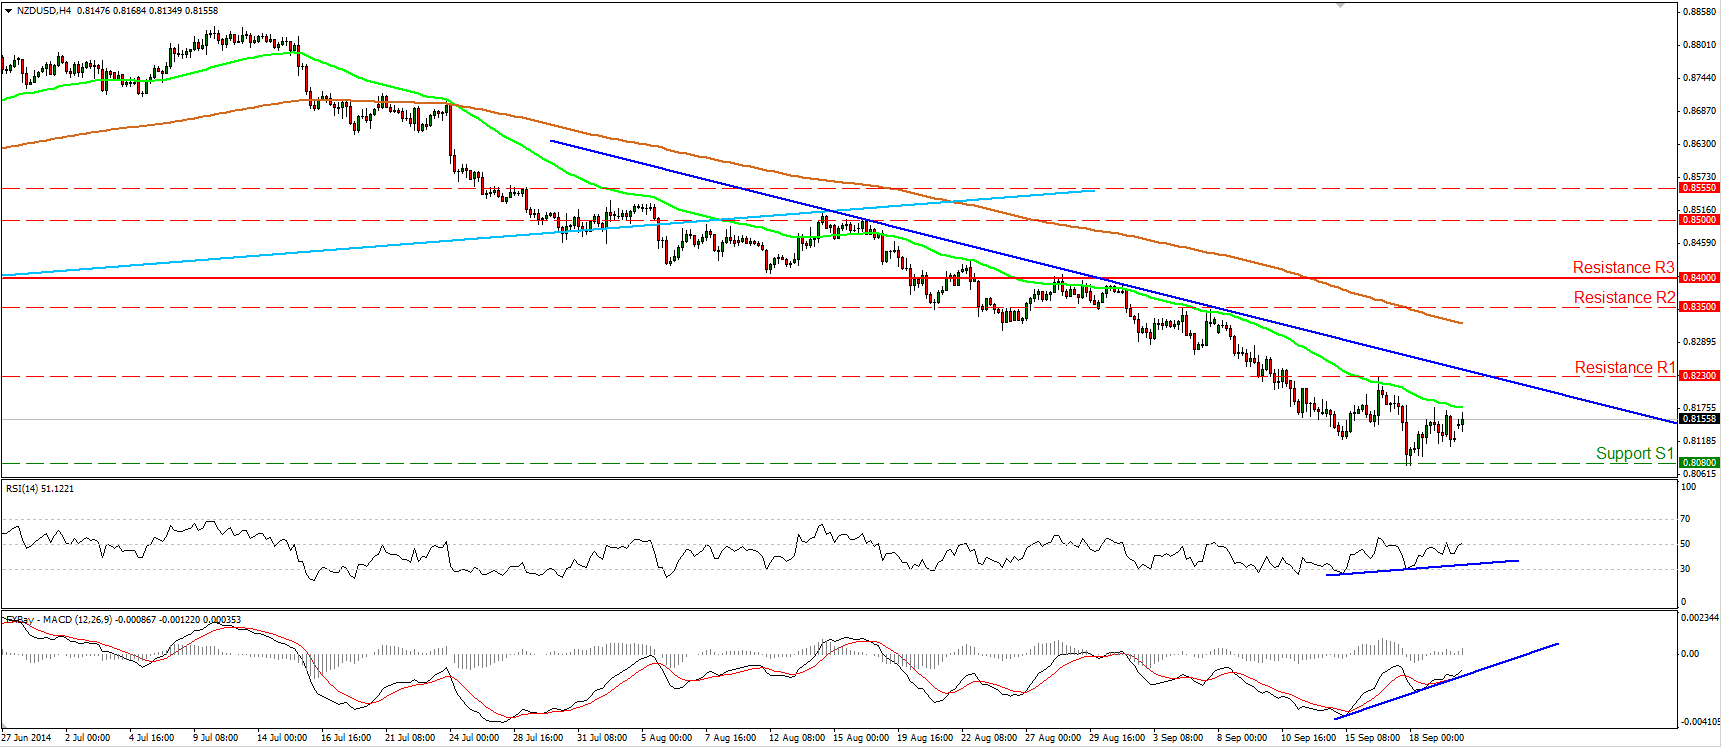
NZD/USD moved higher after finding support at 0.8080 (S1). During the early European morning Monday, the pair is trading between that line and the resistance of 0.8230 (R1). Taking a look at our momentum indicators, I see positive divergence between both of them and the price action, which suggests further upside in the near future, perhaps for a test near the 0.8230 (R1) line. Nevertheless, as long as the pair is trading below the near-term blue downtrend line and below the prior longer-term uptrend line (light blue line), drawn from back at the 30th of August 2013, the overall picture remains negative, in my view. I would expect a dip below the 0.8080 (S1) hurdle in the future to pave the way for the psychological obstacle of 0.8000 (S2).
• Support: 0.8080 (S1), 0.8000 (S2), 0.7930 (S3).
• Resistance: 0.8230 (R1), 0.8350 (R2), 0.8400 (R3).
Gold falls below 1215
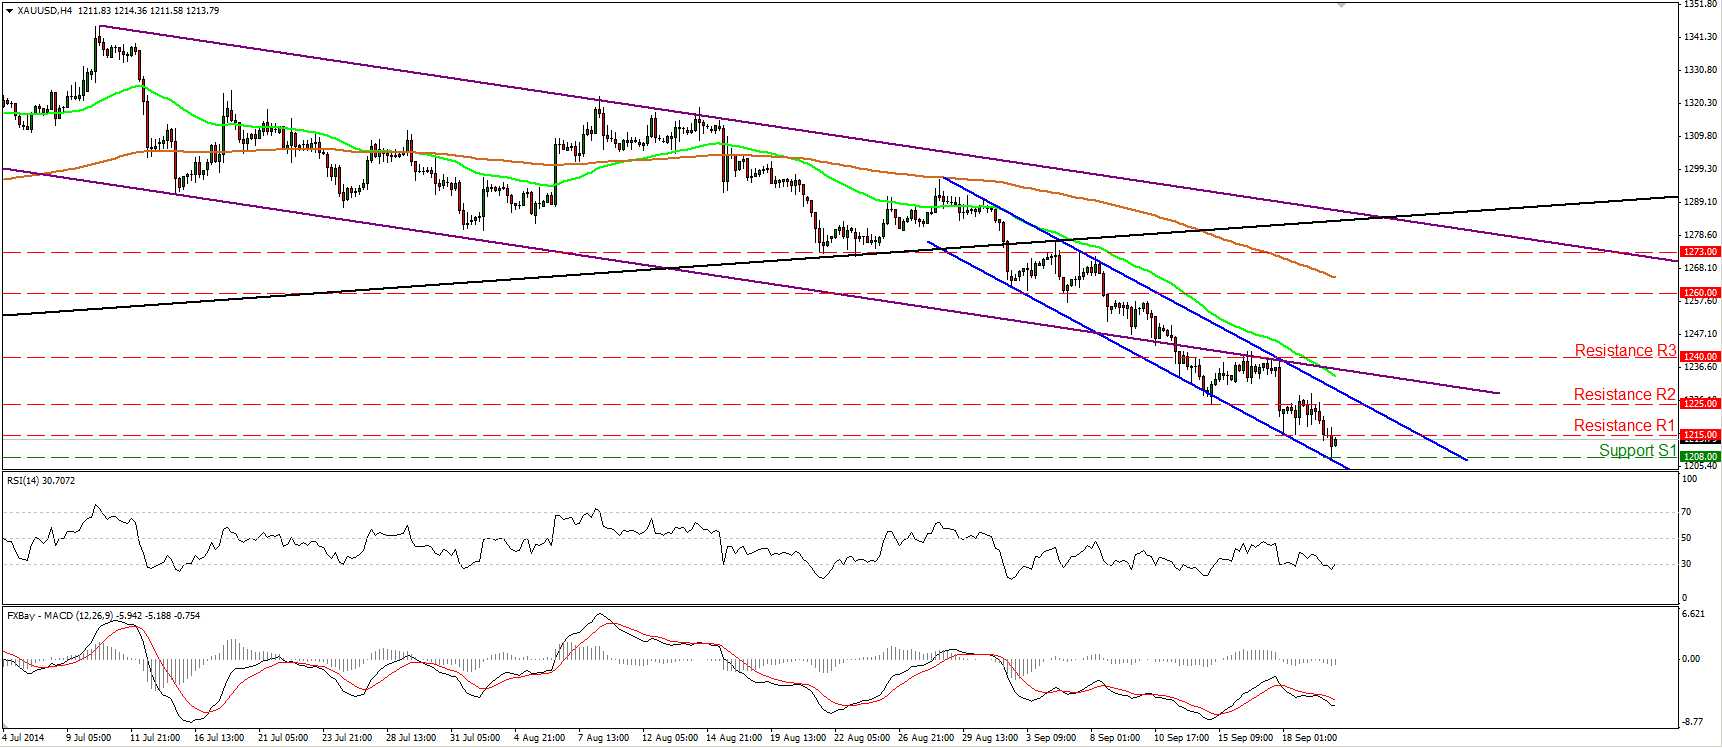
Gold declined on Friday, but it found support at 1208 (S1). Bearing in mind that the precious metal is trading within the near-term blue downside channel and below the black prior support line, drawn from back at the low of the 31st of December, I still see a downtrend and I would maintain the view that we are likely to see the metal challenging the psychological area of 1200 (S2) in the near future. Nevertheless, given our proximity to the lower line of the blue channel, and that the RSI appears willing to cross above its 30 line, I would be mindful of a possible upside corrective bounce before the bears take the reins again, perhaps for a test near the 1225 (R2) line or the upper boundary of the channel.
• Support: 1208 (S1), 1200 (S2), 1180 (S3).
• Resistance: 1215 (R1), 1225 (R2), 1240 (R3).
WTI continues lower
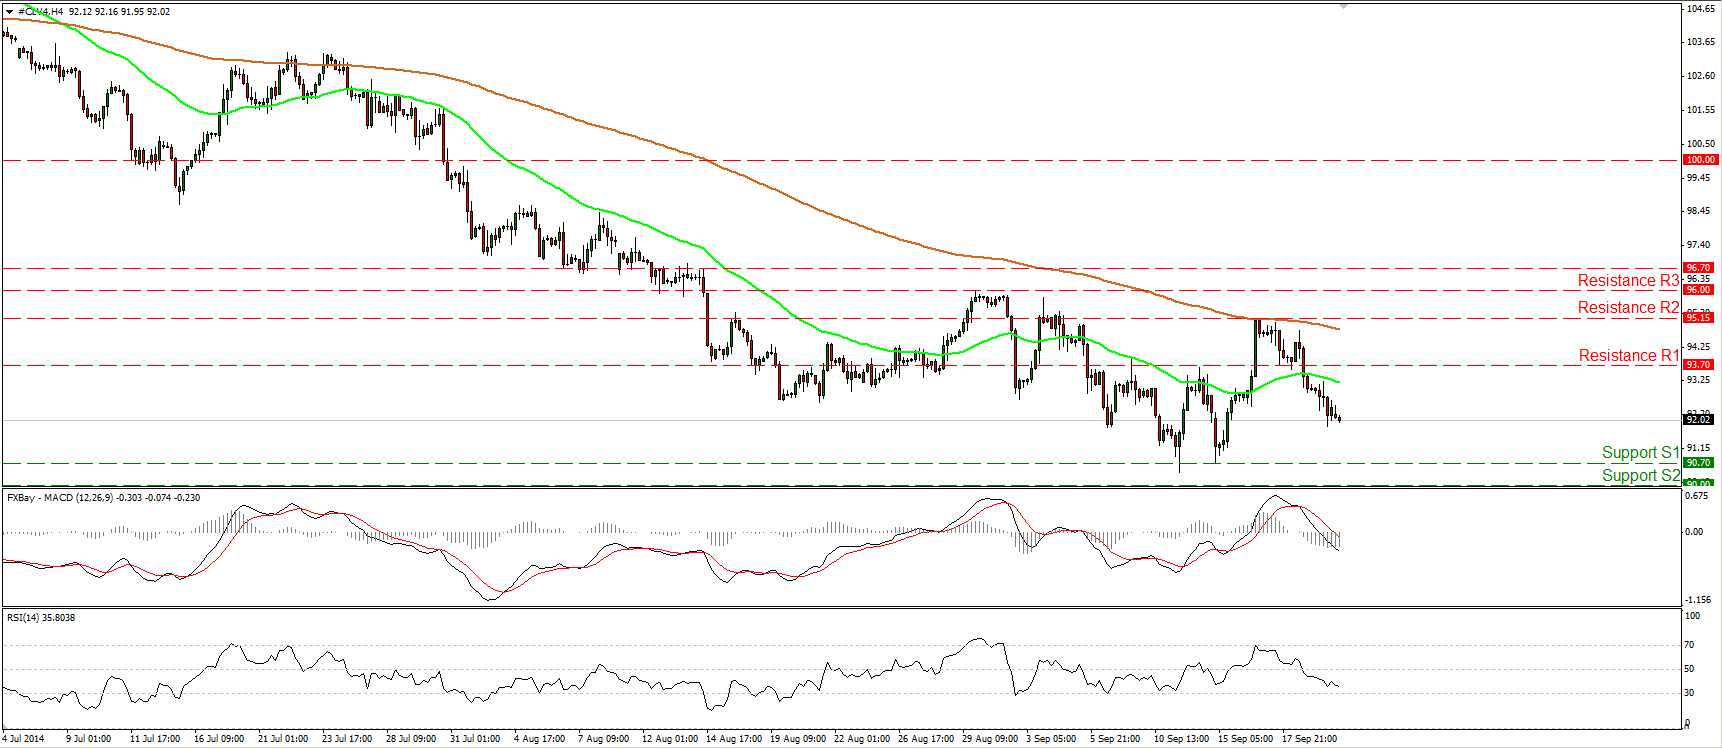
WTI continued its tumble after hitting the 200-period moving average last week. The MACD, already below its signal line, fell below its zero line, while the RSI has more room to go before signaling oversold conditions. This designates bearish momentum and amplifies the case for further near-term declines, perhaps towards the support line of 90.70 (S1). Zooming out on the daily chart, the trend remains to the downside in my view, but I still see positive divergence between both the daily oscillators and the price action. As a result, I would adopt a “wait and see” stance as far as the overall picture of oil is concerned. I would like to see a decisive dip below 90.00 (S2) before getting more confident about the downside.
• Support: 90.70 (S1), 90.00 (S2), 87.65 (S3).
• Resistance: 93.70 (R1), 95.15 (R2), 96.00 (R3) .

