• ECB’s Coeure: The decision to ease in December has not been taken ECB’s Executive Board member Benoit Coeure said on Wednesday that the decision for further easing has not been taken and that the debate is ongoing. The remarks from the Bank official emphasized that the new ECB forecasts provided at their December meeting will be key to decide to act. In the meantime, other Governing Council members including Estonia’s Ardo Hansson and Slovenia’s Bostjan Jazbec have also urged caution over further easing. As not all officials’ clearly support further stimulus or another deposit rate cut, EUR/USD remains supported above 1.07. ECB’s President Draghi testifies before the European Parliament later today, and should his comments confirm Coeure’s “wait and see” stance this has the potential to trigger a short-term EUR rally.
• Overnight, the Australian dollar surged after the Australia’s strong employment report waned expectations of an interest rate cut by the end of the year. The unemployment rate fell to 5.9% in October as the net change in employment soared to 58.6k. The data beat market expectations of an unchanged unemployment rate at 6.2% and an increase of 15k jobs. Overall, the robust jobs report confirmed the upbeat view of the Reserve Bank of Australia (RBA) over the labour market, something that we saw in the Bank’s Statement on Monetary Policy last week as well as in the minutes of their October meeting. The Bank noted that the sector had proved healthier than expected and that forward-looking indicators have generally been consistent with lower unemployment rate in the coming months. AUD/USD rallied on the news, recovering all the losses following the solid US employment report on Friday, while AUD/NZD broke above the downslope trend line taken from the lows of 4th of November and the resistance-turned-into-support level of 1.0870. Given the strength of USD due to the Fed rate hike expectations, I would be cautious for further AUD/USD upside corrections and I would prefer to take advantage of AUD strength against NZD.
• Today’s highlights: During the European day, the final German CPI for October confirmed the initial estimate, thus the market reaction was limited at the release. Eurozone’s industrial production for September is expected to have declined at a slower pace than in August. Having in mind that the Eurozone manufacturing PMI declined in September and that the German IP for the same month fell by more than anticipated, I would expect another disappointment here as well.
• In Sweden, we get the CPI and CPIF for October. The headline inflation rate is forecast to have remained unchanged at 0.1% yoy, while the CPIF rate is expected to have risen by a percentage point. At its latest policy meeting, the Riksbank noted that economic activity in Sweden is strengthening and inflation is showing a clear upward trend. The CPIF data seem to be in line with that view, but bearing in mind that the Bank is very concerned regarding the strength of the global economy and that the ECB looks ready to pull the trigger for further stimulus, we believe that these data will not be enough to ease the pressure from the Riksbank to act again in the foreseeable future. We maintain our SEK bearish view.
• From the US, initial jobless claims for the week ended on Nov. 2 are forecast to have declined to 270k from 276k the previous week. However, this will drive the 4-wk moving average up to 266k from 262k. Although the 4-wk moving average is expected to have risen somewhat, it remains at levels that point to a strong labour market. The Job Opening and Labor Turnover Survey (JOLTS) report for September is due out as well and the forecast is to get the same number of job openings as in August. This survey will also bring the “quit rate,” a closely watched indicator of how strong the job market is. More US job data that point to a robust employment sector are likely to add to expectations for a Fed lift-off in December and support the USD.
• We have two ECB, five Fed, and one BoE speakers on Thursday’s agenda. ECB President Mario Draghi speaks at the Quarterly Hearing of the European Parliament. ECB Governing Council member Jens Weidmann also speaks. From the Fed, we have Chair Janet Yellen, St. Louis Fed President James Bullard, Richmond Fed President Jeffrey Lacker, Chicago Fed President Charles Evans, and New York Fed President William Dudley. BoE Chief Economist Andy Haldane speaks as well.
The Market
EUR/USD trades higher after its hits support at 1.0700
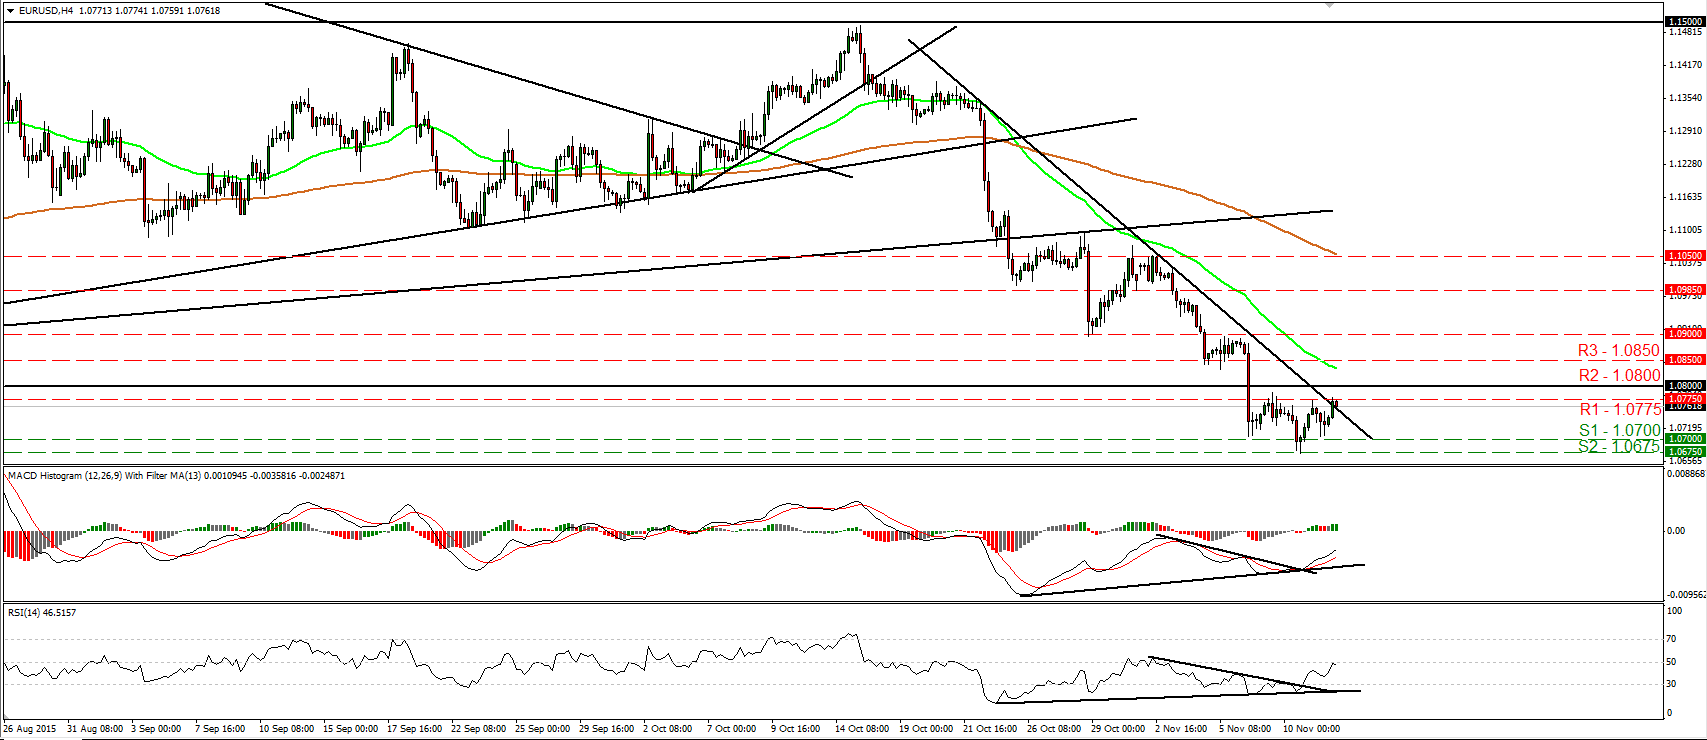
• EUR/USD traded lower on Wednesday, but hit support at 1.0700 (S1) and then rebounded to find resistance at 1.0775 (R1). I still believe that the pair is likely to trade lower in the foreseeable future, but given that the rate moved slightly above the downtrend line taken from the peak of the 21st of October, I believe that the current rebound may continue for a while, even above 1.0800 (R2). Our short-term momentum indicators support the case that the pair could continue correcting higher for now. The RSI continued higher and tested its 50 line, while the MACD stands above its trigger line, points up, and could be headed towards its zero line. What is more, there is still positive divergence between both these indicators and the price action. In the bigger picture, the break below the key support (turned into resistance) area of 1.0800 (R2) on the 6th of November signaled the downside exit from the sideways range the pair had been trading since the last days of April. In my view, this has turned the longer-term outlook negative as well and corroborates my view to treat any possible further advances as a corrective move before sellers take the reins again.
• Support: 1.0700 (S1), 1.0675 (S2), 1.0625 (S3)
• Resistance: 1.0775 (R1), 1.0800 (R2), 1.0850 (R3)
AUD/USD surges on massive Australian jobs data
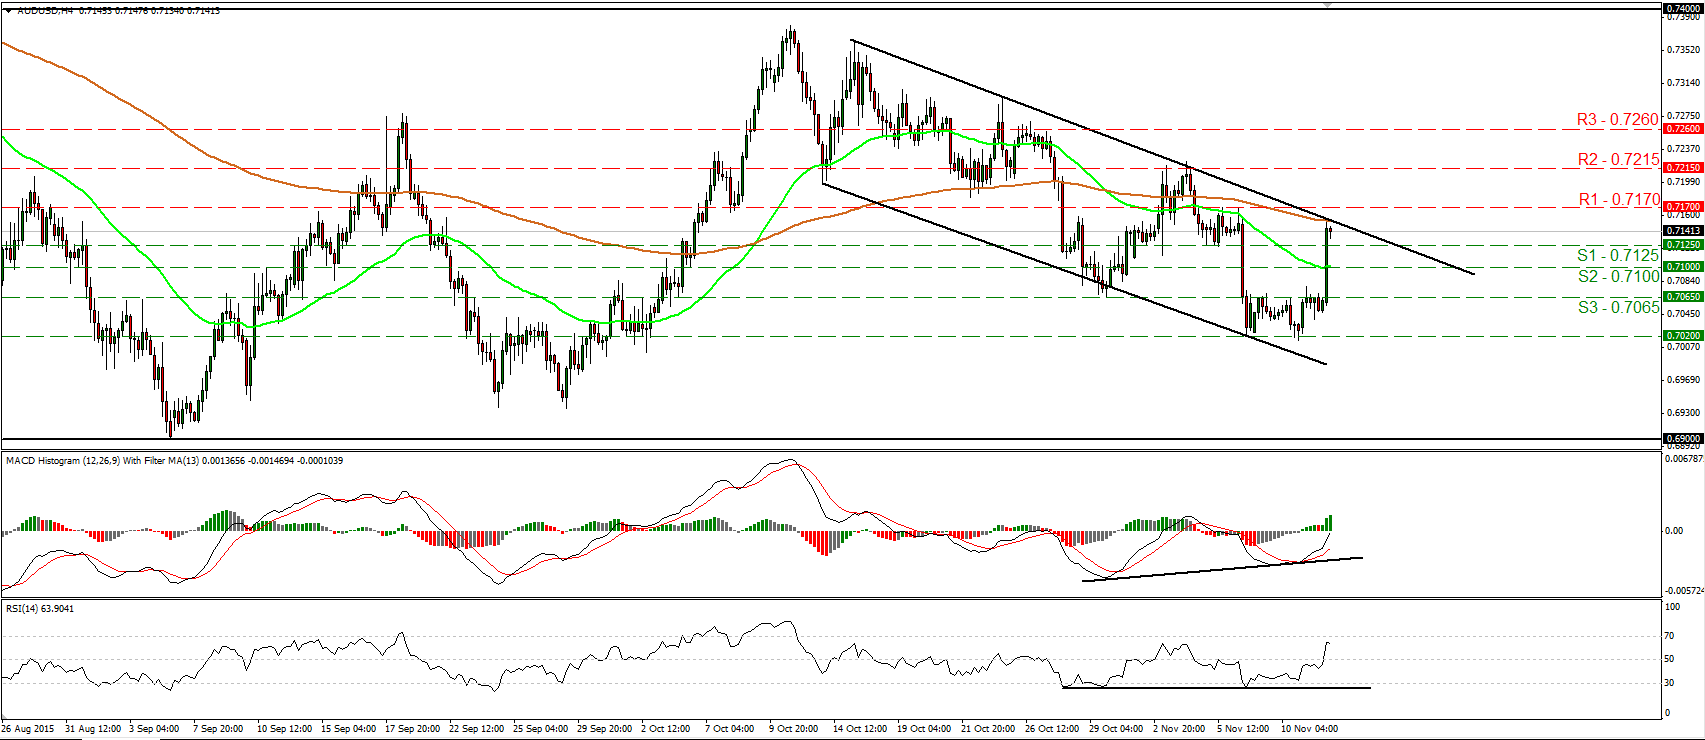
• AUD/USD rallied today during the Asian morning after Australia’s unemployment rate unexpectedly fell to 5.9% in October from 6.2% previously. The pair surged and crushed three resistance barriers in a row to stop at the upper bound of the downside channel that has been containing the price action since the 14th of October. As long as the rate remains within that channel, I believe that the near-term outlook remains negative. However, taking a look at our momentum indicators, I prefer to take the sidelines at the moment. The RSI emerged above its 50 line, while the MACD, already above its trigger line is headed towards zero and could turn positive soon. What is more, there is positive divergence between the MACD and the price action. I believe that a break back below 0.7125 (S1) is needed to confirm that the next leg is likely to be negative. On the daily chart, I see that AUD/USD still oscillates between 0.6900 and 0.7400 since mid-July. As a result, I would hold a flat stance for now as far as the broader trend is concerned as well.
• Support: 0.7125 (S1), 0.7100 (S2), 0.7065 (S3)
• Resistance: 0.7170 (R1), 0.7215 (R2), 0.7260 (R3)
GBP/JPY hits resistance slightly below 187.55
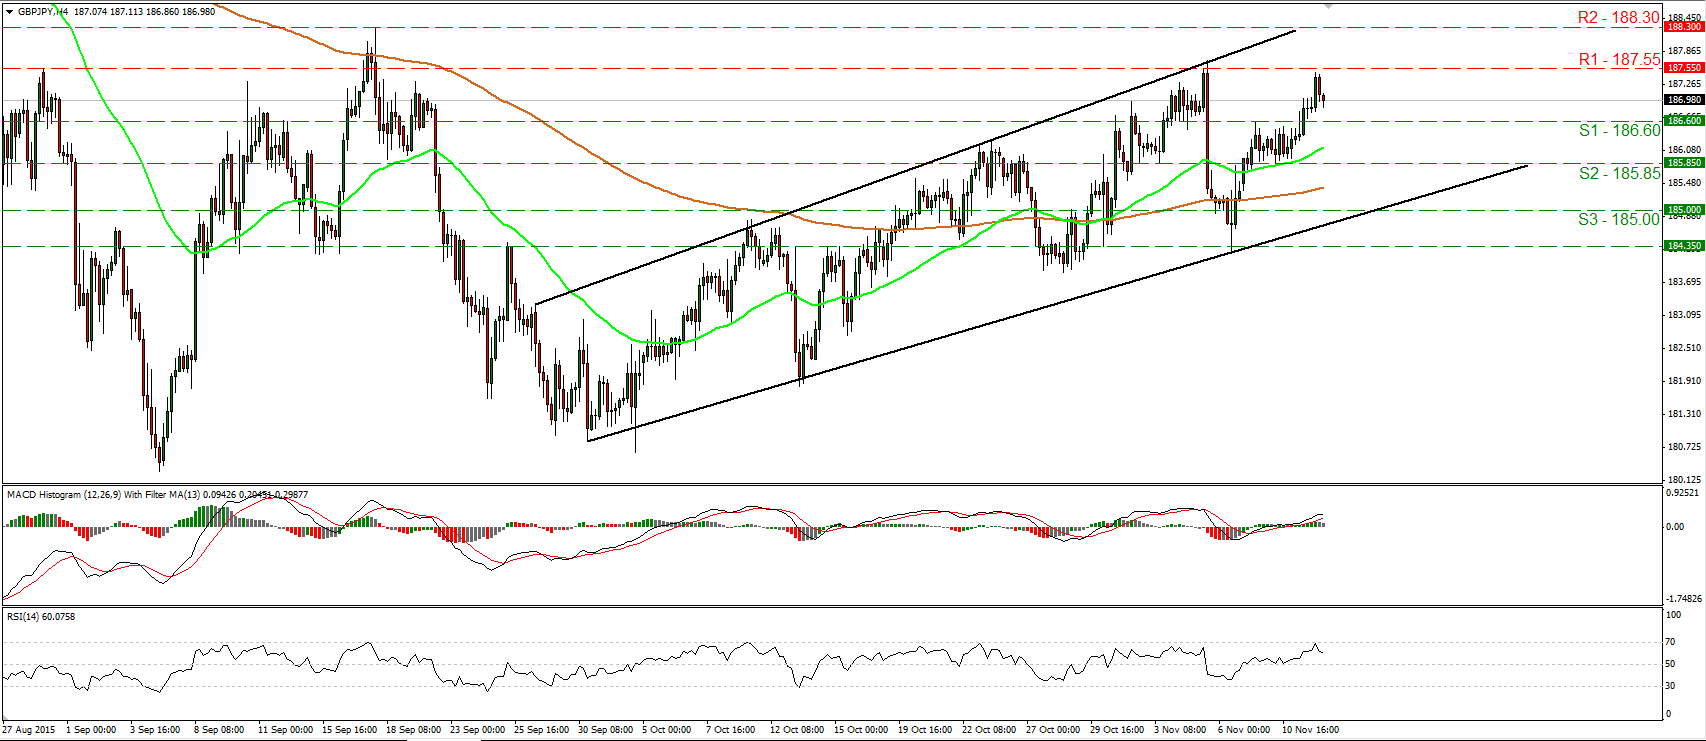
• GBP/JPY traded higher yesterday, breaking above the resistance (now turned into support) barrier of 186.60 (S1). However, the advance was stopped fractionally below our next hurdle of 187.55 (R1) and then the rate retreated. The short-term outlook remains positive in my view and therefore, I would expect a clear move above 187.55 (R1) to open the way for the 188.30 (R2) zone. Taking a look at our short-term oscillators though, further setback could be looming before the next positive leg. The RSI hit resistance at its 70 line and turned down, while the MACD, although positive, shows signs of topping. On the daily chart, I see that the pair started trading higher after it printed a higher low at around 180.65. However, I would prefer to see a clear close above 188.30 (R2) before assuming that the medium-term picture has turned positive.
• Support: 186.60 (S1), 185.85 (S2), 185.00 (S3)
• Resistance: 187.55 (R1), 188.30 (R2), 189.00 (R3)
WTI breaks below 44.00
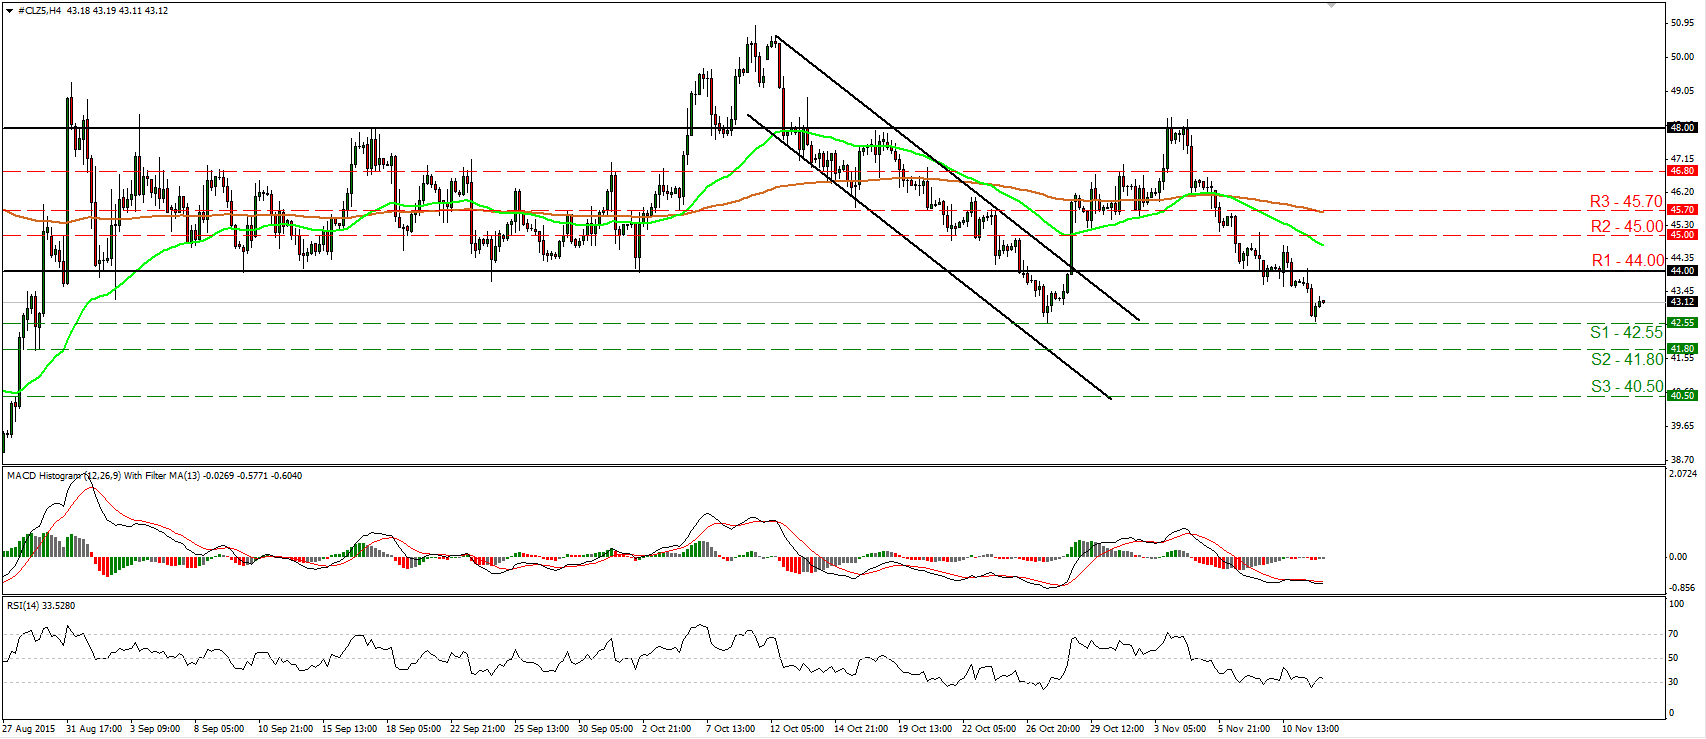
• WTI managed to break below the support (now turned into resistance) hurdle of 44.00 (R1) on Tuesday and yesterday, it continued its tumble to hit support at the 42.55 (S1) line, defined by the low of the 27th of October. The short-term picture looks negative and therefore, I would expect a clear move below 42.55 (S1) to prompt extensions towards our next obstacle of 41.80 (S2), marked by the low of the 28th of August. Taking a look at our momentum studies though, I see signs that an upside retracement could be looming for now before sellers decide to take in charge again, perhaps to test the 44.00 (R1) area as a resistance this time. The RSI rebounded from slightly below its 30 line, while the MACD shows signs of bottoming. On the daily chart, WTI printed a lower high on the 3rd of November. In my opinion, a break below 42.50 (S1) is now needed to confirm a forthcoming lower low and to turn the longer-term outlook back to the downside. • Support: 42.55 (S1), 41.80 (S2), 40.50 (S3) • Resistance: 44.00 (R1), 45.00 (R2), 45.70 (R3)
Gold hits again the 1085 zone
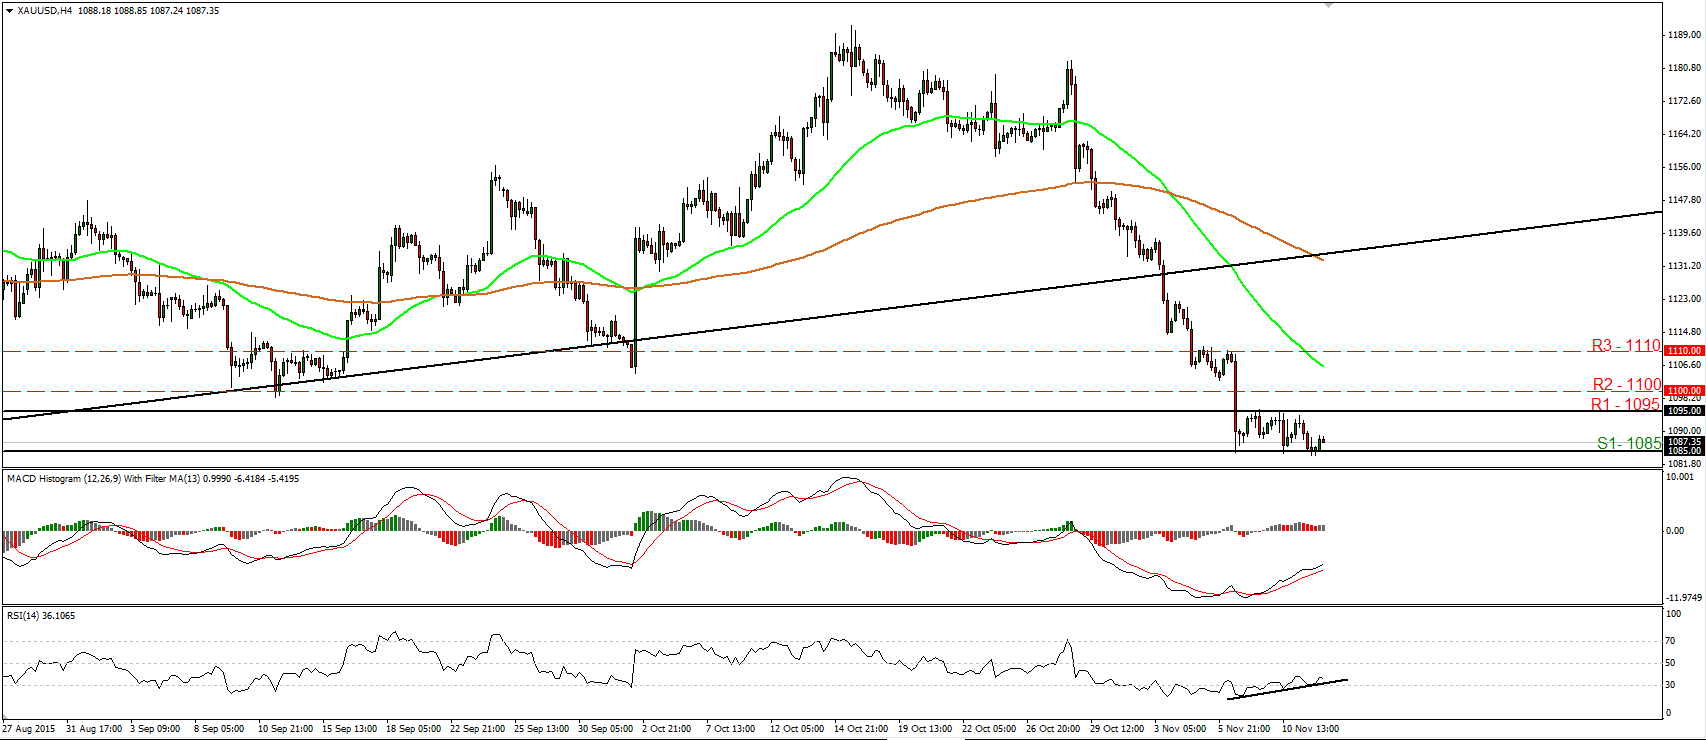
• Gold traded lower yesterday to find support once again near the 1085 (S1) barrier. Then, the metal rebounded somewhat. The metal has been trading in a sideways mode since Monday, between the 1085 (S1) support and the resistance of 1095 (R1). As a result, I would consider the intraday bias to stay neutral for now. Taking a look at our short-term oscillators though, I see signs that an upside corrective bounce could be on the cards. The RSI rebounded from its upside support line, while the MACD, continued higher, above its trigger line, pointing north. I would expect another test at 1095 (R1), where an upside break could challenge the 1100 (R2) zone. On the daily chart, the plunge below the upside support line taken from the low of the 20th of July has shifted the medium-term outlook to the downside. As a result, I would treat any further short-term advances as a corrective move for now. I believe that the metal is poised to trade lower in the foreseeable future.
• Support: 1085 (S1), 1080 (S2), 1072 (S3)
• Resistance: 1095 (R1), 1100 (R2), 1110 (R3)

