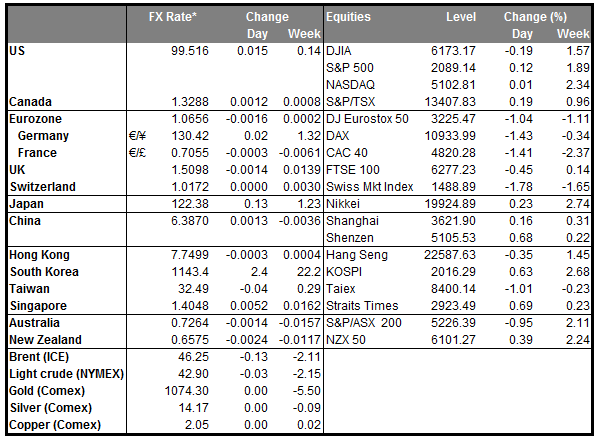
• ECB Draghi: ‘Meeting our objective is about credibility’ ECB President Draghi vowed not to lower the ECB’s inflation target yesterday, stating that “Meeting our objective is about credibility. If a central bank sets an objective, it can't just move the goalposts when it misses it.” ECB President defended the Bank’s current stimulus package by pointing out that a continued period of low inflation, if it becomes persistent, could destabilize inflation expectations. Draghi downplayed the risks the very low interest rates pose to the Eurozone economy by highlighting that one of the biggest risks would be doing nothing instead of acting. After last week’s comments following the rate decision that there are no limits to how far they are willing to go, expectations for additional stimulus in March have increased. Eurozone’s CPI estimate for December, due to be released on Friday, although a bit outdated, should help us to better gauge the probabilities of fresh ECB stimulus. Another failure of Eurozone’s inflation to accelerate could make March a very realistic time for the Bank to pull the trigger. Nevertheless, we prefer to remain cautious, as the Governing Council could under-deliver again.
• OPEC Secretary-General calls for cooperation OPEC Secretary-General has called for cooperation between oil-producing nations, even outside the cartel, to help stabilize oil prices. The vice-president of Lukoil (OTC:LUKOY), Russia’s second biggest oil producer, said they would not oppose a cut in output if it was politically backed by Russia. Saudi Arabia has also stated recently that it would consider cutting output if joined by large producers outside OPEC, such as Russia. Oil exporting economies have been under increasing pressure lately, which increases the chances for a possible cooperation to raise and stabilize oil prices, especially if prices fall further. However, there are still barriers to a possible output decrease, with Iran having expressed its intention to raise production further to regain market share, as the sanctions are now lifted. Thus, we would need to see a serious drop in output for the prices to bottom out, in our view.
• As for today’s highlights, we only get indicators from the US. The SnP/Case-Shiller house price index for November is forecast to have accelerated from the previous month. However, bearing in mind that new, existing and pending home sales all declined in the same month, a minor acceleration in house prices may not be enough to offset the overall soft performance of the housing sector in November. The FHFA house price index for the same month is also coming out. The preliminary Markit service-sector PMI for January is expected to have declined somewhat from the previous month. The Richmond Fed manufacturing index for January is due to be released, but no forecast is available. The Conference Board consumer confidence index for January is expected to have remain unchanged from the previous month. Given that the preliminary U of M consumer sentiment increased in January we see the possibility for an upside surprise in the Conference Board as well. This could support the dollar somewhat.
• We have only one speaker on Tuesday’s agenda: Bank of England Governor Mark Carney is expected to testify to Parliament on the latest Financial Stability Report. He may highlight again the global economic risks and persistent factors weighing on inflation and repeat that “now is not yet the time to raise rates.” Since the pound fell sharply on these comments the last time, repetition of the same comments could have limited impact today, in our view.
The Market
EUR/USD trades higher and hits 1.0860
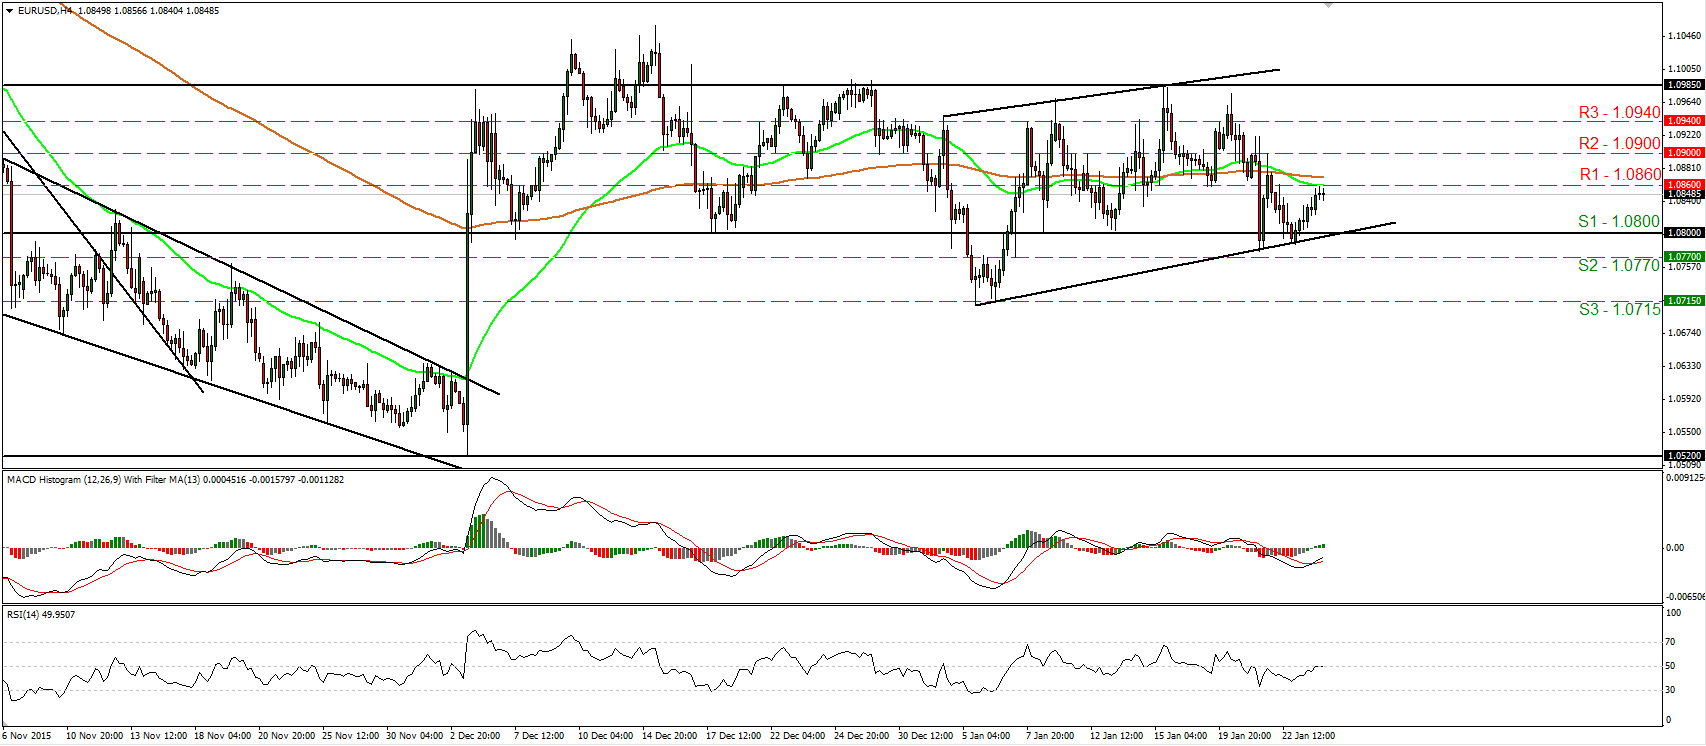
• EUR/USD traded higher on Monday after it rebounded from near the upside support line taken from the low of the 5th of January. The pair managed to reach our resistance area of 1.0860 (R1), where a clear break is likely to extend the rebound, perhaps towards the 1.0900 (R2) line. However, although it is possible for EUR/USD to continue trading higher for a while, as long as it is trading between the 1.0800 (S1) line and the resistance zone of 1.0985, I would still consider the short-term trend to be to the sideways. Shifting my attention to our short-term oscillators, I see that the RSI edged higher and is now testing its 50 line, while the MACD, although negative, has bottomed and crossed above its trigger line. In the bigger picture, I will hold the view that as long as the pair is trading above the key support zone of 1.0800 (S1), the medium-term picture stays flat as well.
• Support: 1.0800 (S1), 1.0770 (S2), 1.0715 (S3)
• Resistance: 1.0860 (R1), 1.0900 (R2), 1.0940 (R3)
GBP/USD slides after hitting a downtrend line
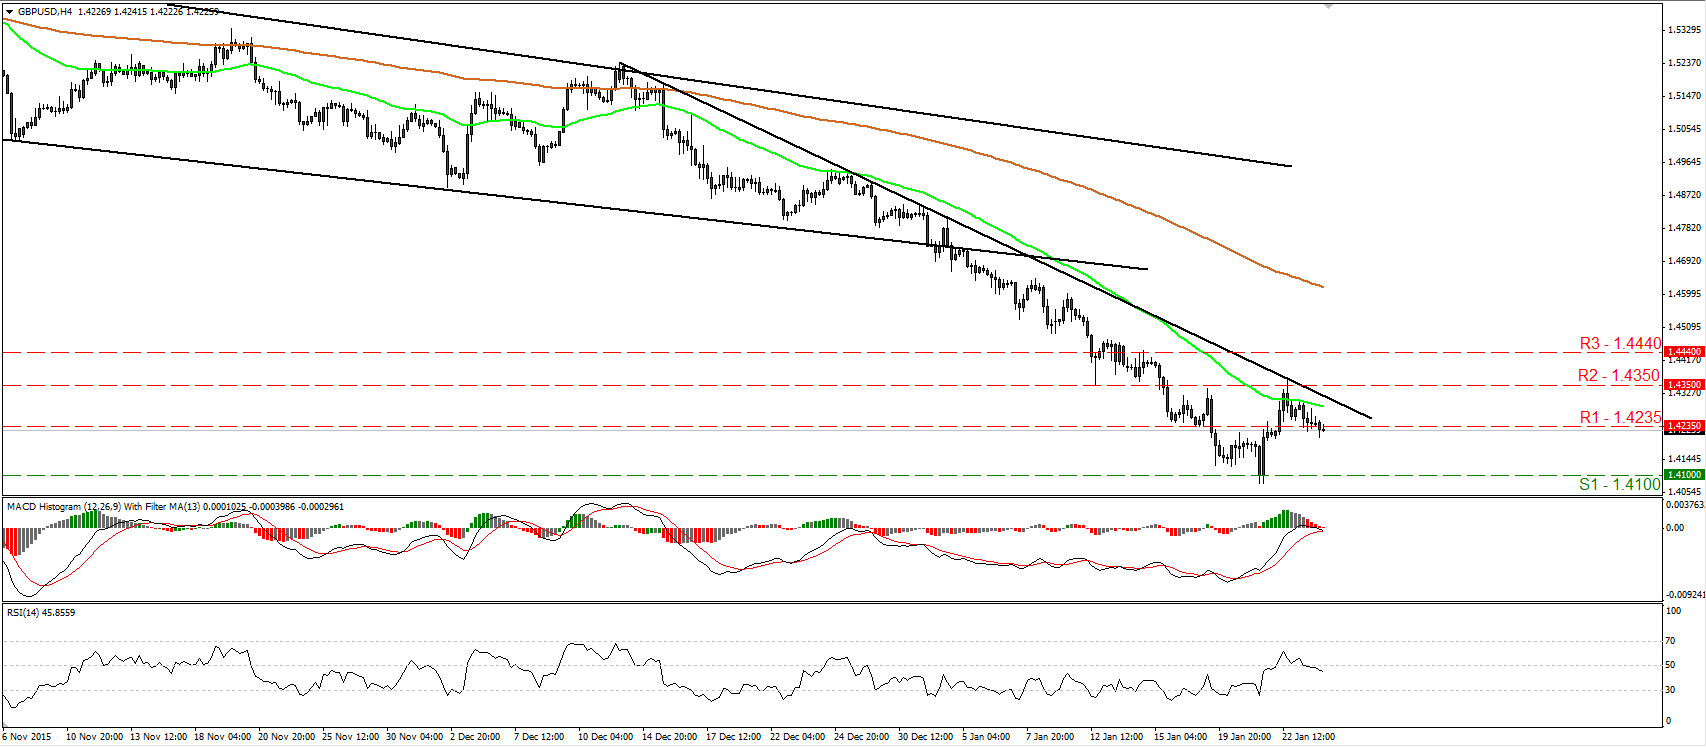
• GBP/USD slid after it hit resistance at the downtrend line taken from the peak of the 11th of December, slightly above the 1.4350 (R2) obstacle. As long as the pair is trading below that downtrend line, I still consider the short-term outlook to be negative and I believe that last week’s recovery was just a corrective move. I would expect the bears to continue pushing the rate lower and perhaps challenge the 1.4100 (S1) zone. Our short-term oscillators reveal downside momentum and amplify the case for further declines. The RSI is back below its 50 line and points down, while the MACD has topped, turned negative, and now looks able to fall below its signal line. In the bigger picture, the price structure remains lower peaks and lower troughs below the 80-day exponential moving average, which is pointing down. Thus, I still see a negative longer-term picture as well.
• Support: 1.4100 (S1), 1.4000 (S2), 1.3850 (S3)
• Resistance: 1.4235 (R1), 1.4350 (R2), 1.4440 (R3)
USD/JPY hits resistance at 118.80 and slides
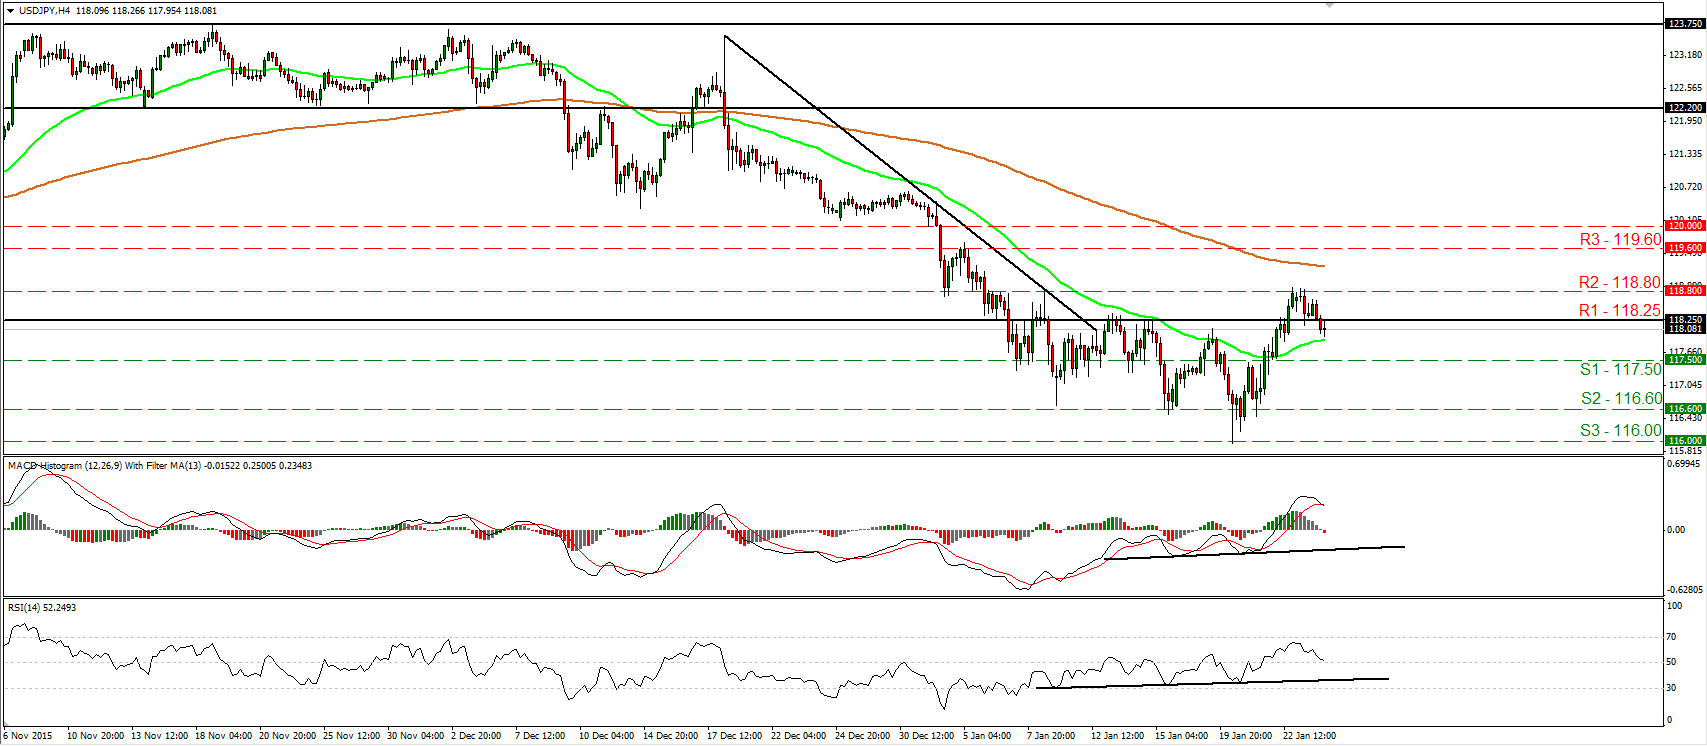
• USD/JPY tumbled yesterday after it hit resistance near the 118.80 (R2) hurdle. The rate is back below the 118.25 (R1) zone, which makes me believe that the pair is poised to continue lower for a while, perhaps for a test at our 117.50 (S1) support line. Looking at our momentum indicators, I see that the RSI turned down and looks ready to move below its 50 line, while the MACD, although positive, has topped and just crossed below its trigger line. These indicators support the case that USD/JPY is possible to continue trading lower, at least in the short run. As for the broader trend, the fact that the rate is back below the key zone of 118.25 (R1) keeps alive the possibilities for a longer-term trend reversal.
• Support: 117.50 (S1), 116.60 (S2), 116.00 (S3)
• Resistance: 118.25 (R1), 118.80 (R2), 119.60 (R3)
Gold emerges above 1110
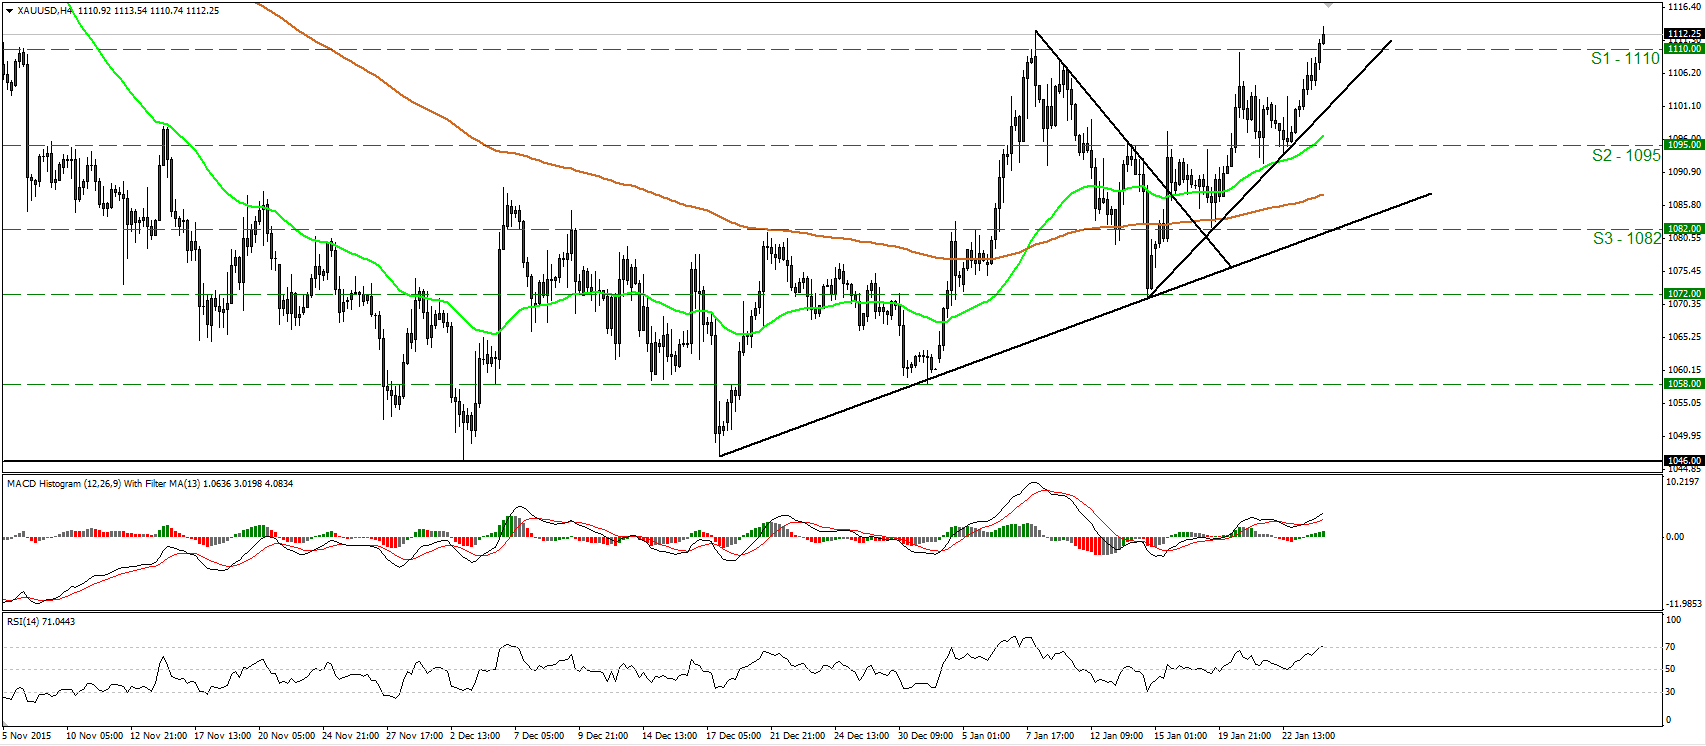
• Gold traded higher yesterday, breaking above the resistance (now turned into support) area of 1110 (S1). The price structure remains higher peaks and higher troughs above the short-term uptrend line taken from the 14th of January and as a result, I would consider the near-term outlook to stay positive. I believe that the move above 1110 (S1) is likely to carry more bullish extensions and perhaps target our next obstacle of 1122 (R1). Our short-term oscillators detect strong upside speed and support the notion. The RSI surged above its 70 line, while the MACD, already positive, stands above its trigger line and points up. As for the broader trend, the break above 1110 (S1) has confirmed a forthcoming higher high on the daily chart, something that keeps the medium-term outlook somewhat positive.
• Support: 1110 (S1), 1095 (S2), 1082 (S3)
• Resistance: 1122 (R1), 1132 (R2), 1140 (R3)
DAX futures hit resistance at 9840 and turned down
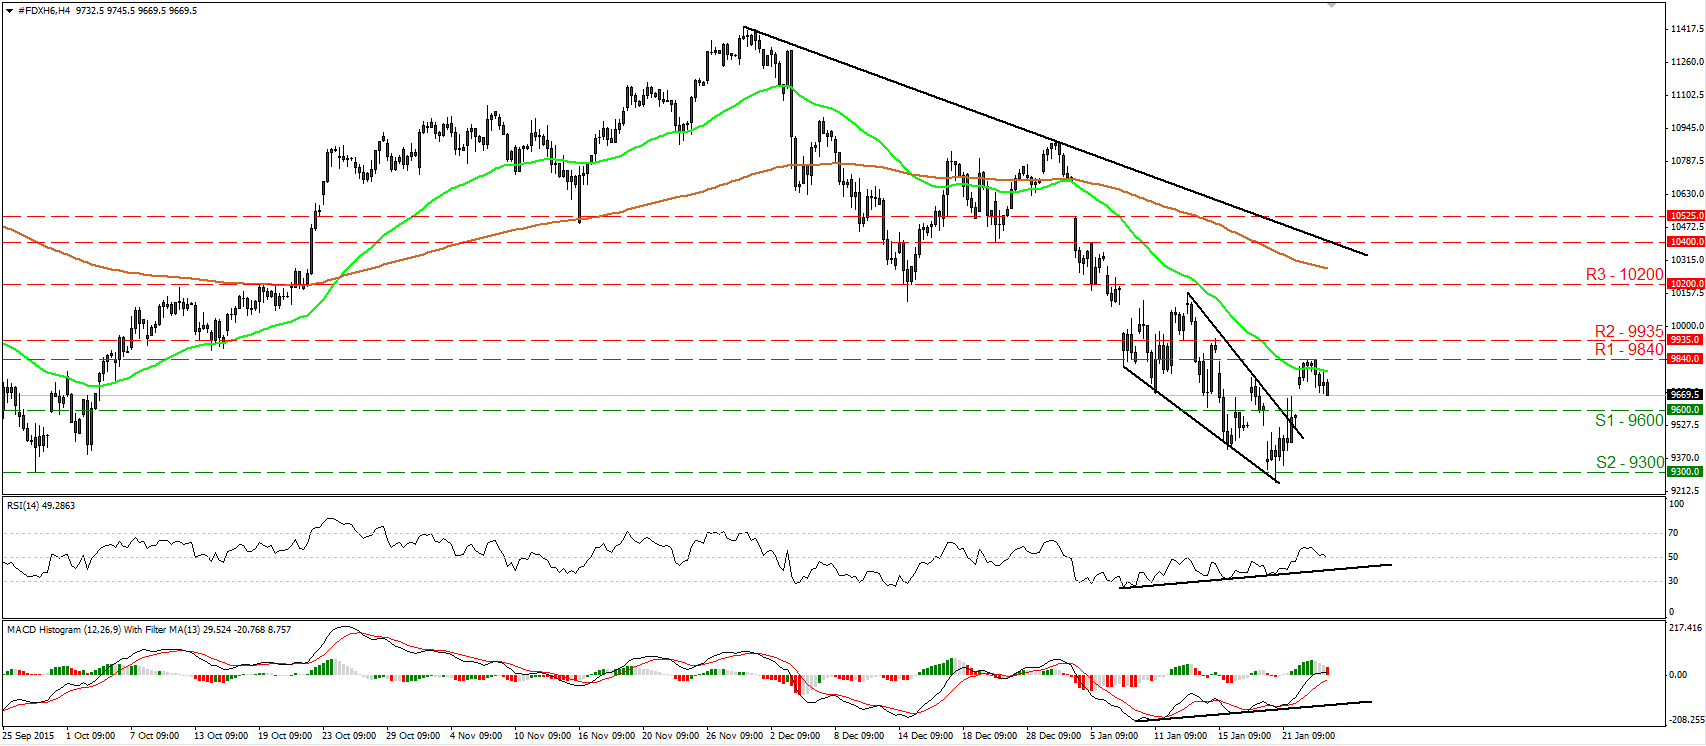
• DAX futures traded lower on Monday after it hit resistance at 9840 (R1). Now the index looks to be headed for a test at the 9600 (S1) support line, where a decisive dip is possible to prompt extensions for another test at the key support zone of 9300 (S2). Our short-term oscillators provide amble evidence that DAX is poised to continue lower for a while. The RSI has turned down and just fell below its 50 line, while the MACD, although slightly above zero, shows signs of topping and could turn negative any time soon. On the daily chart, I see that since the 1st of December the index has been printing lower peaks and lower troughs, something that keeps the longer-term picture negative.
• Support: 9600 (S1), 9300 (S2), 9100 (S3)
• Resistance: 9840 (R1), 9935 (R2), 10200 (R3)


