The forward looking Earnings Per Share (EPS) for all S&P 500 companies combined increased last week from $160.40 to $160.66.
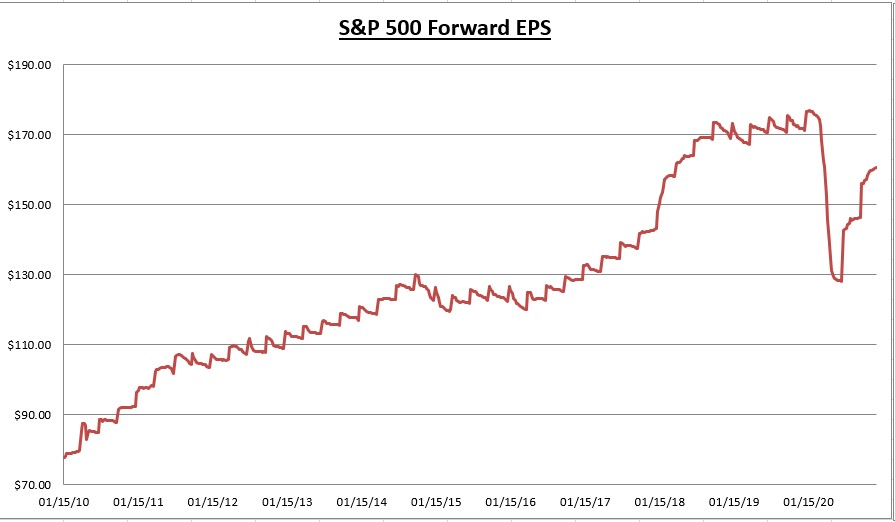
The forward looking Earnings Per Share (EPS) for all S&P 500 companies combined increased last week from $160.40 to $160.66. With now 499 out of 500 companies having reported Q3 results, 84% of companies have beat earnings estimates, and 79% of companies have beat revenue estimates. In the aggregate, earnings have come in 19.5% above expectations, which is well above average.
It looks like Q3 earnings will be down about -6% from Q3 last year, led by the -100% decline in earnings from the Energy sector. 2020 earnings (combines the 3 quarters that have been reported and current 4th quarter earnings estimates) are down -15.23%. 2021 earnings growth estimates are currently +22.5%, and 2022 growth estimates are currently +16.6%.
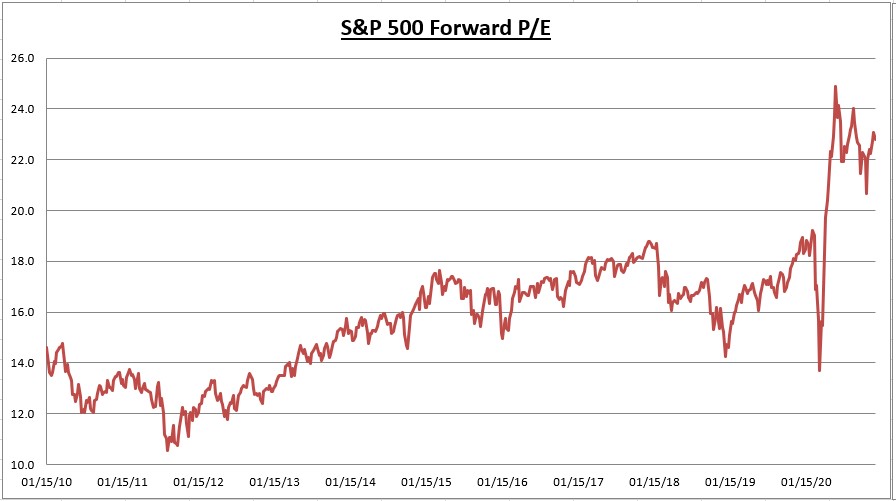
The S&P 500 price index declined 0.96% last week while the earnings per share increased. This led to a decline in the price to earnings ratio (PE) from 23.1 to 22.8. Like 2019, it looks like 2020 will be another year of “multiple expansion”. We know the equation for stock market returns is: Dividend yield + Earnings growth + or—change in valuation (price to earnings ratio). So what I mean by “multiple expansion”, is when the market goes higher without earnings growth. Clearly, the market is looking ahead to brighter days.
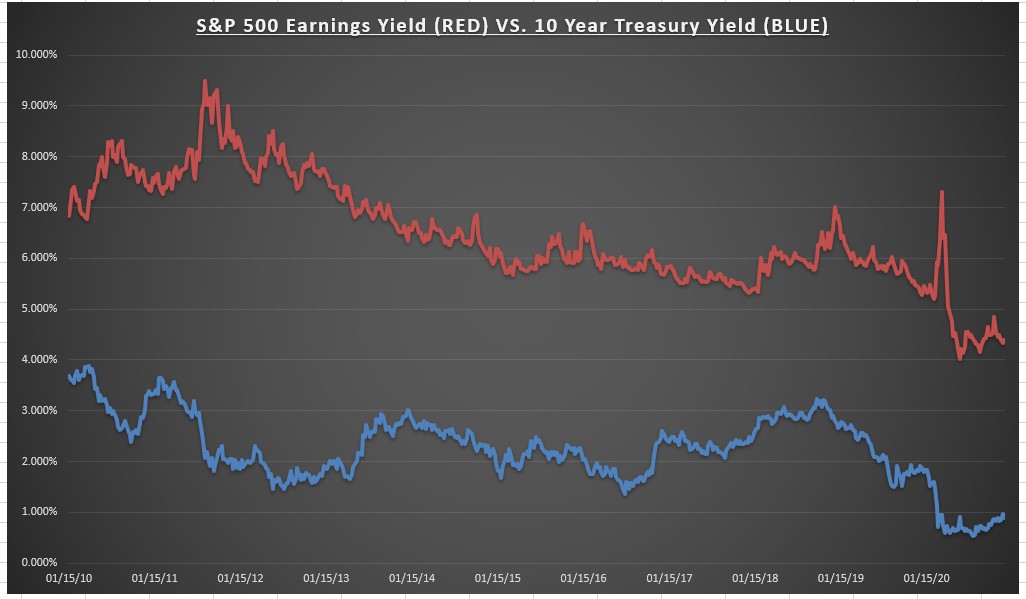
The earnings yield on the S&P 500 increased from 4.34% to 4.39% last week, while the 10-year treasury bond rate fell from 0.97% to 0.89%. Stock valuations adjusted for interest rates still look attractive.
Economic Data Review
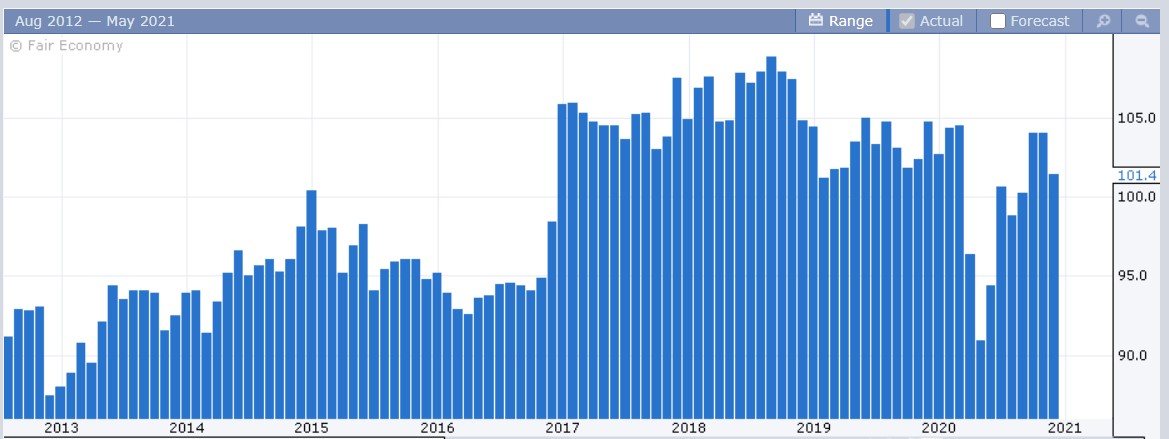
NFIB Small Business Optimism came in at 101.4, down from 104.0 last month. The index is still well above the 47 year average of 98. The biggest contributing factor was the decline in the outlook for general business conditions over the next 6 months. That data point fell from 27 to 8 this month. To put this in context, outlook for general business conditions hit a low of 5 in March. So this is telling us that small business owners are almost as pessimistic now as they were when COVID first hit.
Clearly COVID is having a larger impact on small businesses. The reimplementation of some restrictions bring back painful memories, while the runoff elections for the remaining two Senate seats could be the difference between higher corporate taxes or not.
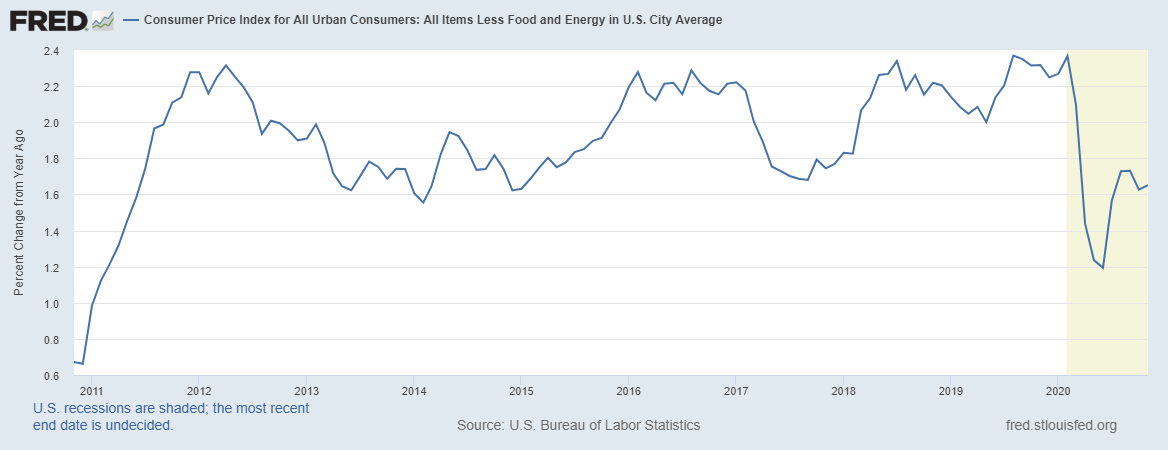
On the inflation front, the Consumer Price Index (CPI) rose 0.2% over the prior month—higher than expected—which translates to an increase of 1.65% from last year. The largest increases came from Used cars and trucks (+10.9% from last year) and Medical care services (+3.2% from last year), while Apparel (-5.2% from last year) and Transportation services (-3.4% from last year) show the largest decreases. Energy costs are down 19% from last year but the Core CPI excludes food and energy because of their volatile nature.
Clearly inflation is no threat in the near term, but between 1) historic increases in the money supply, 2) uptick in the velocity of money, and 3) decline in the USD, I expect some inflationary pressure by the 2nd half of 2021.
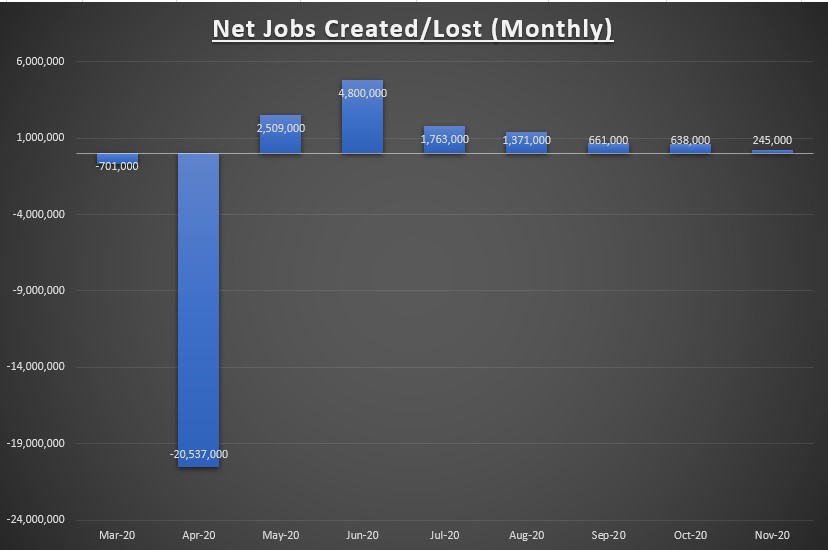
I forget to touch on this last week, so lets briefly review the November jobs report. There was a net 245,000 jobs created in November, which was a sharp slowdown from the prior months. This makes 7 straight months of gains, but we’ve still only recovered about 56% of the net job losses that occurred in March & April. At an average pace of +245,000 jobs created per month, it would take another 38 months to completely recover (or a little over 3 years).
There are a few reasons for the slowdown last month. The most obvious being the reimplementation of restrictions, also less seasonal hiring since more business is being done online this year, and a reduction in government jobs due to the census expiration.
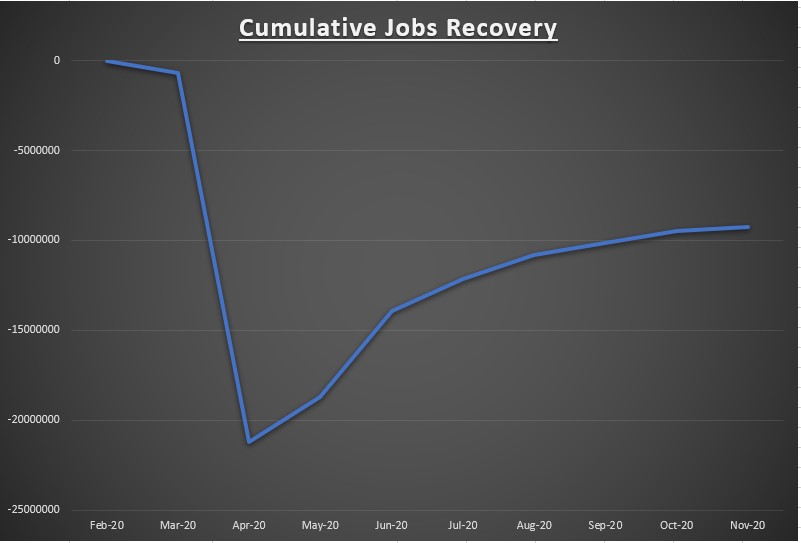
The above chart shows the cumulative jobs lost/recovered each month. A total of 21.2 million jobs were lost due to the COVID lockdowns. After seven months of recovery, there are still 9.251 million jobs needed to restore the pre-COVID high point in employment.
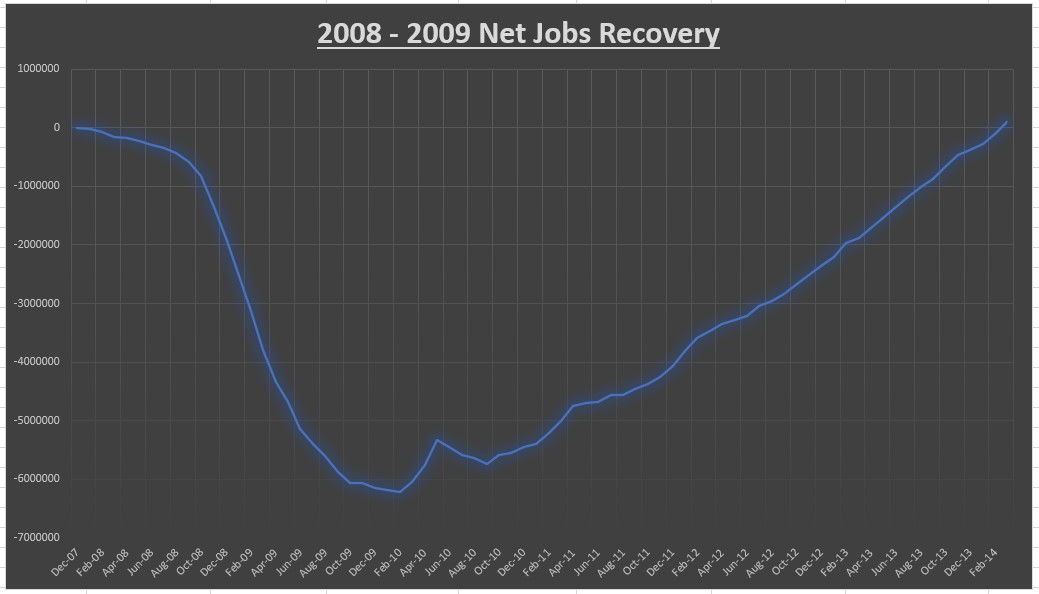
This is a completely different recession scenario, so I’m not making any comparisons here. But lets take a look at the 2008-2009 jobs recovery. Starting in January 2008, there would be 26 straight months of job losses, which culminated in a cumulative net 6.213 million jobs lost (bottoming in February 2010). It would then take 49 months to eventually recover all the net jobs lost during the 2008 recession. In total, from peak to trough, it took 75 months (or 6.25 years).
This is only to say that unfortunately the jobs recovery typically takes time. Net jobs lost in 2020 was more than 3x the amount that was lost during the 2008 recession. The difference is that 2020 was all due to self imposed restrictions, whereas 2008 was due to severe financial imbalances. My hope and belief is that the 2020 jobs recovery will be sooner than in 2008.
We can actually look to China for signs of life. Some recent comments from corporations with significant exposure to China said the following;
“China domestic travel has mostly reached full recovery, as we shared earlier. Domestic hotel and air booking have both turned positive growth since August, and especially the high-end business and short-haul travels have recovered well.” – Trip.com CEO Jane Sun
“If you look at China right now where things are pretty much back to normal, you will see our businesses are performing well there, people are socializing outside the home again” – Diageo CEO Ivan Menezes
“There’s no question that the bounce back in China has been much faster than in any other region. Although I wouldn’t say that they’re back at a 100%, right. There’s still travel restrictions and so forth. So I think that in terms of patient volumes, it’s also good to think about 90%, 95%, they’re probably closer to the higher end of the range than elsewhere.” – Danaher CEO Rainer Blair
Summary
The recovery is well underway and is likely to pick up steam next year (although Q1 2021 could be soft), but downside risks remain elevated compared to pre-COVID levels. This is not the time to take on excessive risk, but there is no reason to run from it either.
We have some important economic data points on tap this week, with Retail Sales coming in on Tuesday and the Conference Board’s Leading Economic Indicators Index released on Friday. We also have a Federal Reserve meeting on Wednesday (don’t expect anything new), and some earnings from FedEx (NYSE:FDX) and Nike (NYSE:NKE).
