
Dunkin' Brands Group, Inc. (NASDAQ:DNKN) operates through its Dunkin’ Donuts and Baskin-Robbins brands that serve hot and cold coffee and baked goods, as well as hard-serve ice cream.
Going forward, the company’s comps should gain from menu innovation and unit expansion plans. Moreover, various sales and digital initiatives undertaken by the company bode well. Further, the company’s renewed multi-year partnership with Keurig Green Mountain and J.M. Smucker, signed in 2015, to manufacture, market, distribute and sell Dunkin' K-Cup pods at retailers in the U.S. should continue to aid Dunkin Brands’ top line.
However, challenging comps growth in international markets at both its divisions is a potent headwind. Further, immense competition in the breakfast segment could hurt the company’s top line in the near term.
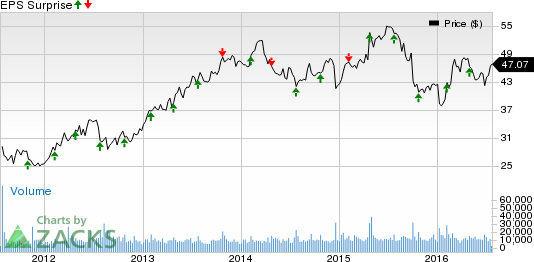
Investors should note that the consensus estimate for DNKN has hardly witnessed any significant movement over the last 60 days. Meanwhile, DNKN’s earnings have been strong over the past few quarters. In fact, the company posted positive earnings surprises in all of the last four quarters, with an average beat of 3.12%. Revenues too outpaced/met the Zacks Consensus Estimate in all of the trailing four quarters.
DNKN currently has a Zacks Rank #3 (Hold) but that could change following Dunkin' Brands earnings report which was just released. We have highlighted some of the key stats from this just-revealed announcement below:
Earnings: DNKN beats on earnings. Our consensus earnings estimate called for earnings per share of 56 cents per share, and the company reported earnings of 57 cents per share. Investors should note that these figures take out stock option expenses.
Revenues: DNKN reported revenues of $216.3 million. This missed our consensus estimate of $220 million.
Key Stats to Note: System-wide sales increased 3.8%, comparing unfavorably with the prior quarter increase of 4.4%. However, adjusted operating income margin was 51.5%, up 280 basis points year over year.
Dunkin’ Donuts U.S. comps increased 0.5% while the international division posted a 3.1% decline. Baskin-Robbins’ U.S. comps increased 0.6%, while the international segment posted an 6.6% decline.
For full-year 2016, Dunkin’ Brands now expects revenue growth of between 3% to 5% (earlier 4%--6%) taking into account the sale of company-owned stores in the second quarter as well as projected future sales of the same in 2016. Meanwhile, it continues to expect adjusted operating income growth of between 8% and 10% and adjusted earnings per share in the range of $2.20 to $2.22.
Stock Price Impact: In-active in pre-market trading.
Check back later for our full write up on this DNKN earnings report later!
Want the latest recommendations from Zacks Investment Research? Today, you can download 7 Best Stocks for the Next 30 Days. Click to get this free report >>
DUNKIN BRANDS (DNKN): Free Stock Analysis Report
Original post
Zacks Investment Research