Have US stocks entered a bear market?
In most assets, MSM (mainstream media) uses a 20% decline as a rule of thumb to define a bear market. While an asset that’s declined 20% mightbe in a bear market, that rule of thumb is at best a very crude attempt to define the overall price action.
Different assets require different rules of thumb. Dow Theory provides a time-tested means of classifying the US stock market as bullish or bearish.
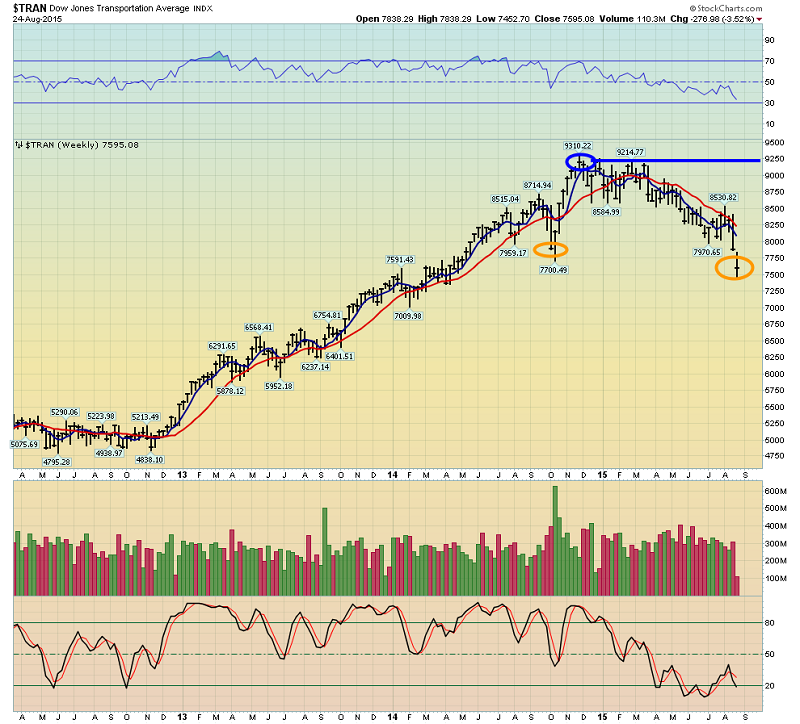
That’s the weekly chart of the Dow Jones Transportation index.
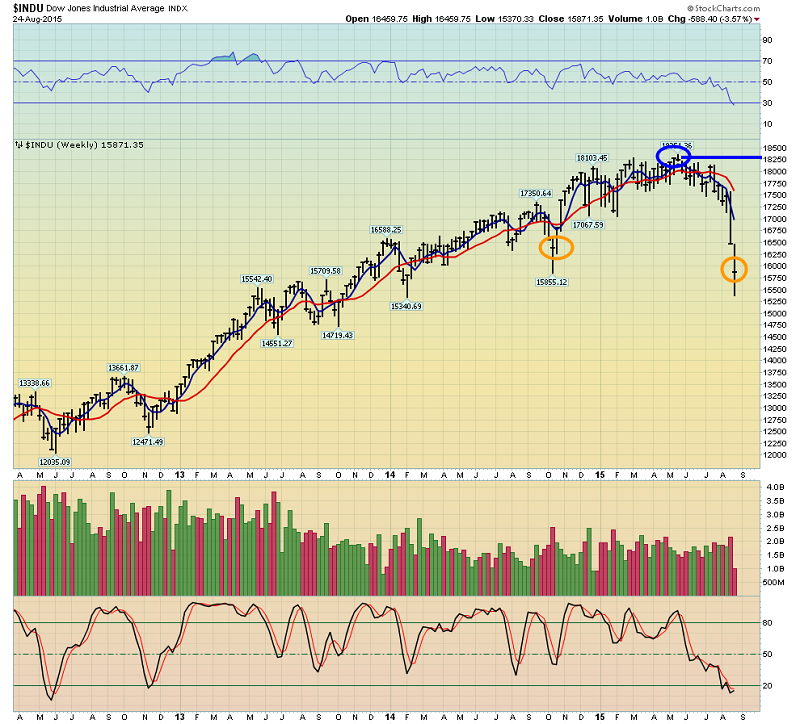
That’s the weekly chart of the Dow Jones Industrials index.
In terms of time, a Dow Theory sell signal is quite a long process; both averages must make a series of lower intermediate trend lows and highs. In the case of the current market, that may happen, but it hasn’t happened yet.
The professional Dow Theorist is now watching for an intermediate trend rally to occur in both averages. If they fail to breach the recent highs, that in itself is not a sell signal.
A sell signal would occur only if both averages then decline and close below yesterday’s closing prices.
For decades, I have defined the August 7 – October 31 time frame as “crash season”. There’s no question that current US stock market price action is very concerning.
The real risk of being invested in US stocks during these three months dramatically outweighs any potential reward. That’s because generational wealth can be destroyed in a few days, weeks, or even hours. August is typically the set-up month, and the crash and/or ensuing bear market occurs in either September or October.
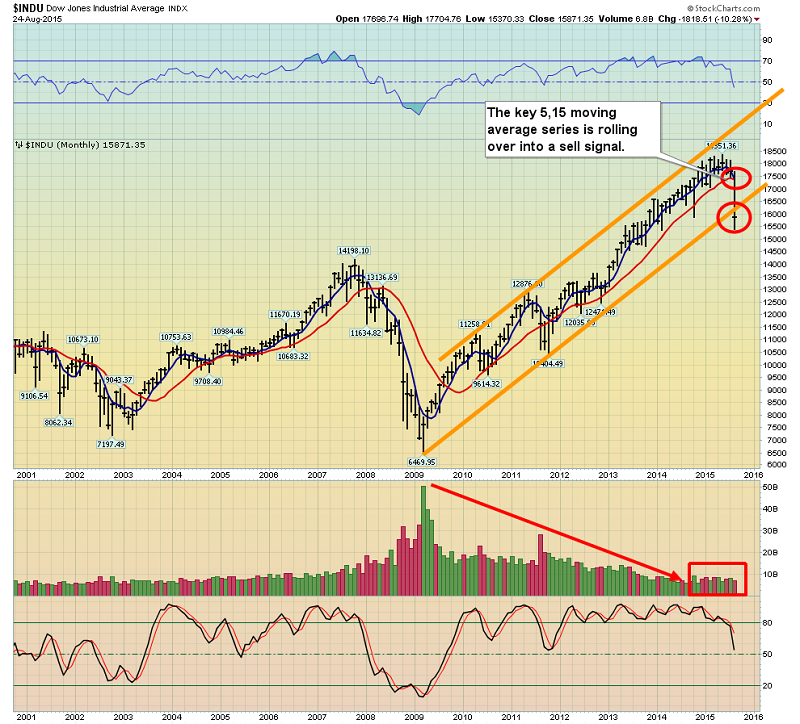
That’s a monthly chart of the Dow Industrials. The uptrend from the 2009 lows has been broken, and the key 5,15 moving average series is rolling over, ominously. I’m a buyer of the Dow only at 14,200, which is where massive buy-side horizontal support (HSR) begins.
Gold and silver enthusiasts are disappointed that there was not a rush into gold as the Dow tumbled. The SPDR ETF (NYSE:GLD) holding did rise modestly, from about 677 tons to 681, but yesterday’s price action was slightly negative.
The safe-haven trade for gold relates more to key bond markets than to stock markets. In my professional opinion, there are two reasons that Janet Yellen would hike rates. The first is to boost money supply velocity (by boosting bank loan profits).
I also think that Janet shares Alan Greenspan’s concerns about the long term economic problems caused by the size of government. Military spending and entitlement programs don’t do much for money supply velocity. In contrast, by raising rates, Janet can direct institutional liquidity flows away from the T-bond market, away from government, and into the private sector.
Rate hikes can reverse declining money supply velocity, and potentially quite violently. That’s good news for gold and silver bugs! Obviously, I’m 100% in favour of a September rate hike. Regardless of when it occurs, global stock and bond markets could stage a horrific meltdown after the first rate hike, while gold and silver rally strongly!
Fortunately or unfortunately, depending on your perspective, most of the price action in the gold market is not directly related to economic events in the West. It’s mainly related to demand for gold jewellery versus mine and scrap supply in India. The key point is that when Indian demand is very strong, gold-bullish events in the West can cause enormous surges in the price.
Likewise, when Indian demand is tepid, events in the West that “should be bullish” don’t have much effect on the price, and that can frustrate gold enthusiasts. Ominously, when Indian demand is weak (typically from February to July/August), events in the West that are bearish for gold can cause substantial declines in the price.
The good news right now is that Indian jewelers, refiners, and economists are forecasting very strong demand over the next four months! That means any event in the West that is even modestly bullish for gold could send the price much higher.
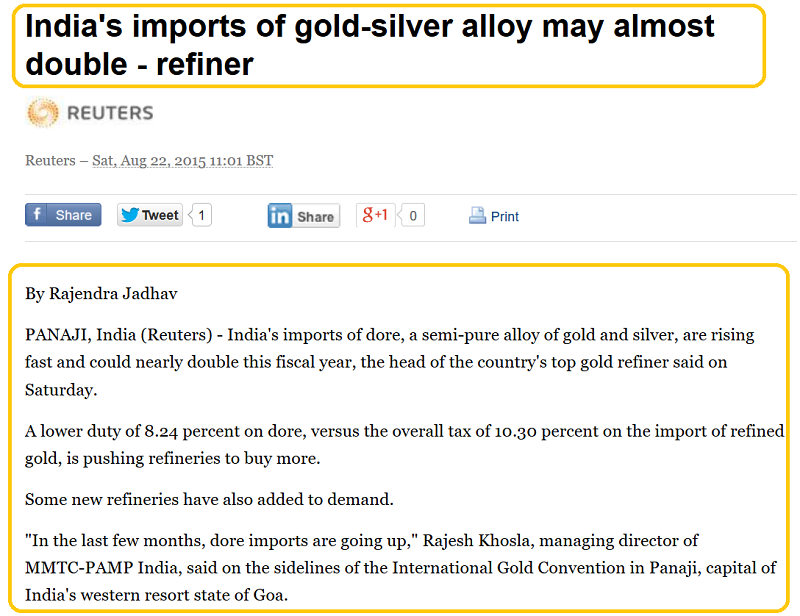
Indian Dore bar imports are surging, with refiners predicting 50% growth this year. The lower duty is a key factor, and I expect this to continue for many years.
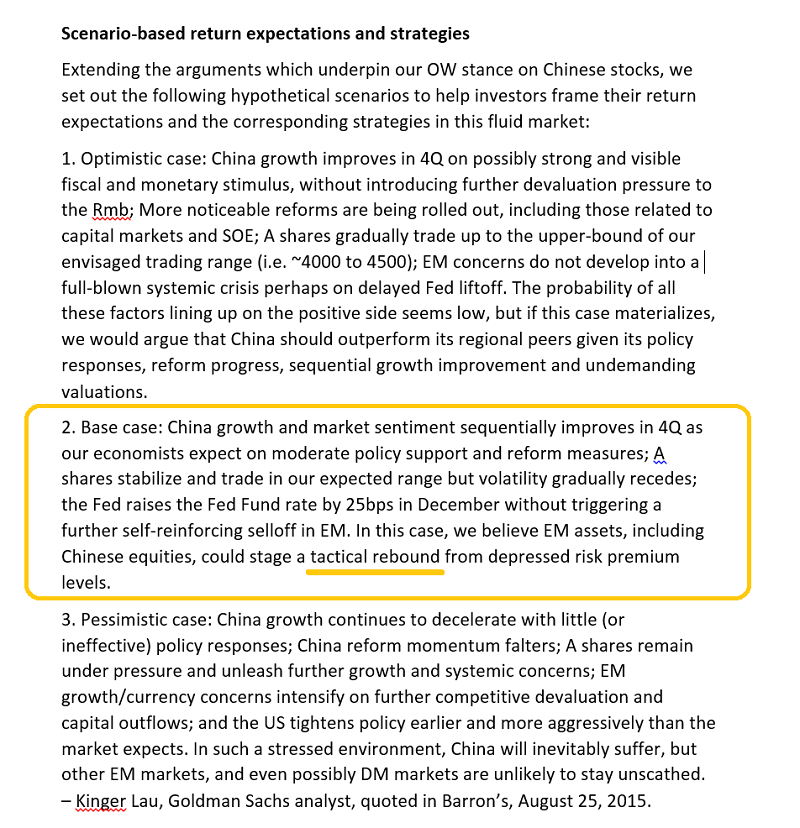
China is also a key source of demand for gold. That’s one take on China, from a key Goldman Sachs (NYSE:GS) analyst. I’ll add that Hong Kong’s stock market sports an average P/E ratio of about 8. The PBOC has plenty of room to cut rates substantially, and the country has almost $4 trillion in FOREX reserves.
The Chinese stock market is suffering a hard landing, but I don’t see the Chinese economy suffering the same fate. Even if there is a hard landing, China doesn’t need to grow dramatically to boost gold demand consistently. Modest growth is fine, and that’s in play now.
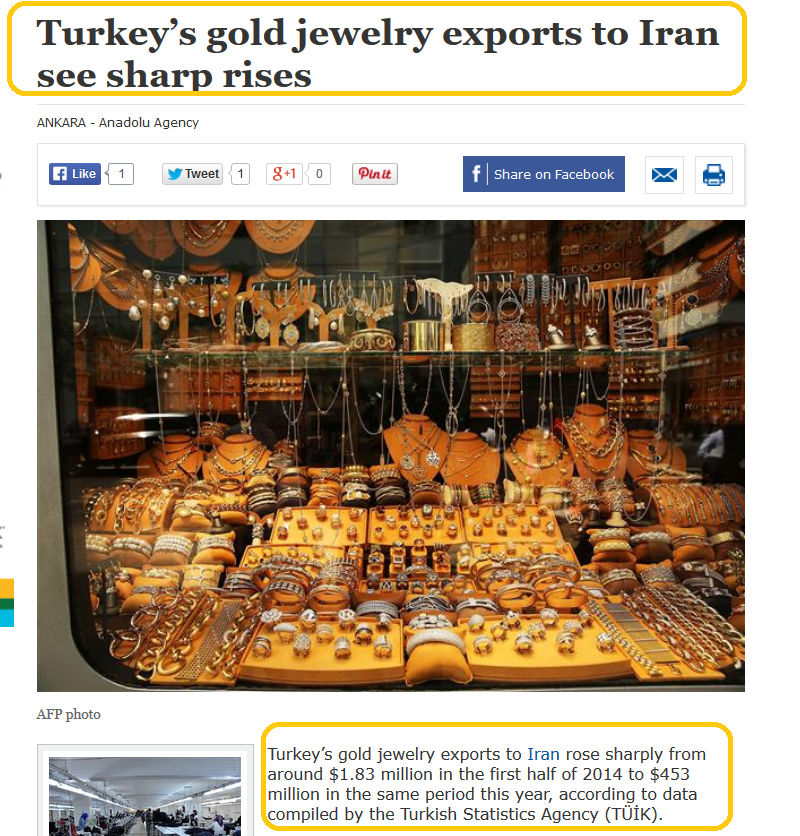
Another overlooked area of gold demand is Iran. I’ve predicted that Iran will become an economic “powerhouse”, while Saudi Arabia declines. Iran bought a staggering 200 times more gold jewellery from Turkey this year than last year. Switzerland has also started re-exporting gold to Iran. Once all the Western sanctions are gone, I’m projecting that Iranian gold jewellery demand will reach 300 - 400 tons a year very quickly, making it the third most important gold market in the world!
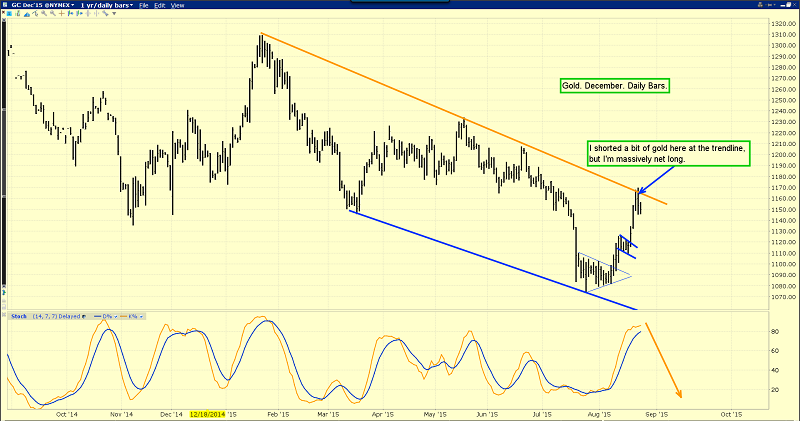
That’s the daily gold chart. After what is roughly a $100 rally, investors need to be patient, and prepare for a pullback.
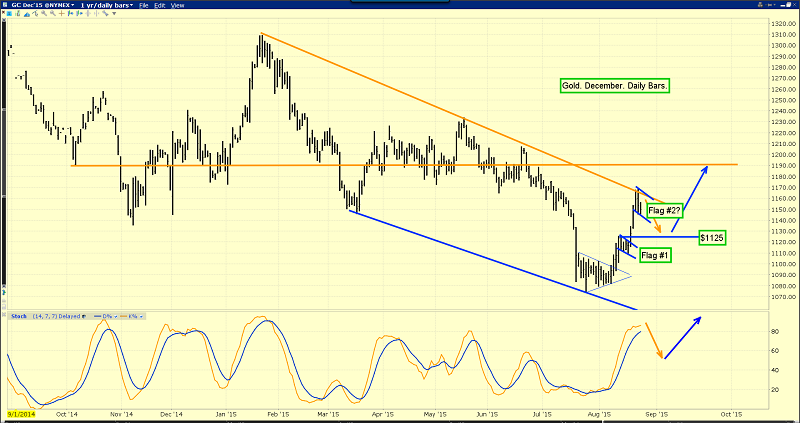
That’s another look at the same chart. There may be a second flag pattern forming, which is very bullish. A pullback to $1125 is more likely, but overall the chart looks solid.
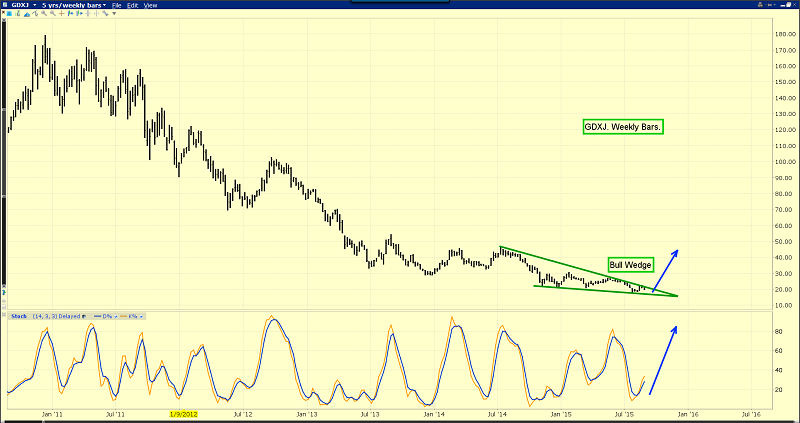
That’s the (NYSE:GDXJ) weekly chart. There’s a great looking bull wedge pattern in play, with an intermediate term target of $45. I realize that junior gold and silver stock enthusiasts are in a bit of pain after yesterday’s general market meltdown, and there could be more if gold declines to the $1125 area. Investors don’t need to “grin and bear it”. They need to grin and buy it! The strong season for gold is off to a typical start, with gold quite strong, and the stocks very volatile. The junior gold stocks will take the lead baton soon, and start the rise to $45 on the GDXJ chart
Thanks!
Cheers
Written between 4am-7am. 5-6 issues per week. Emailed at aprox 9am daily.
Stewart Thomson is a retired Merrill Lynch broker. Stewart writes the Graceland Updates daily between 4am-7am. They are sent out around 8am-9am. The newsletter is attractively priced and the format is a unique numbered point form. Giving clarity of each point and saving valuable reading time.
Risks, Disclaimers, Legal
Stewart Thomson is no longer an investment advisor. The information provided by Stewart and Graceland Updates is for general information purposes only. Before taking any action on any investment, it is imperative that you consult with multiple properly licensed, experienced and qualified investment advisors and get numerous opinions before taking any action. Your minimum risk on any investment in the world is: 100% loss of all your money. You may be taking or preparing to take leveraged positions in investments and not know it, exposing yourself to unlimited risks. This is highly concerning if you are an investor in any derivatives products. There is an approx $700 trillion OTC Derivatives Iceberg with a tiny portion written off officially. The bottom line:
Are You Prepared?
