Dow Jones Industrial Average climbs as investors love U.S. stocks
The Dow Jones Industrial Average (DIA) gained 0.3% for the week while the SP500 (SPY) gained 0.1%. The Nasdaq (QQQ) dropped 0.5% as Apple (AAPL) lost 1.1% for the week. The Russell 2000 (IWM) fell 2.1%.
Big name stocks like Apple, (AAPL) Amazon (AMZN) and Tesla (TSLA) all fell from the previous Friday’s close.
On My Stock Market Radar
So the current situation is that the major indexes have put in recent tops and then failed at breaking above them. Furthermore, the Russell 2000 (IWM) and Nasdaq (QQQ) are generally market leaders and now start to show weakness. The Dow Jones Industrial Average (DIA) remains on a point and figure “sell” signal and has put in an all too obvious double top formation.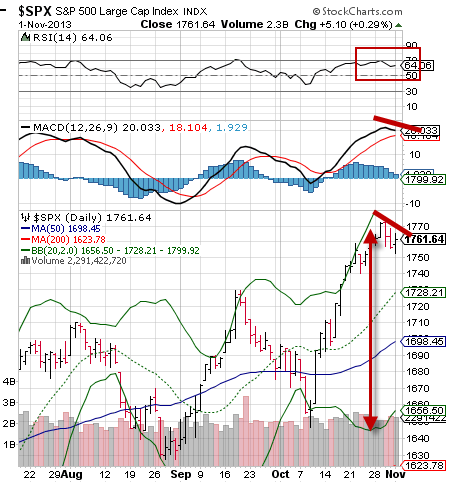
A glance at the SP500 (SPY) chart above shows us that the index is near overbought levels with momentum declining with its price declining and near the outer limit of the upper Bollinger Band®. A quick glance to the past on this chart shows that over-extensions like this one usually result in declines to the lower band which is some 5% from today’s level.
Stock Market News You Can Really Use
Economic reports were mostly positive last week with China’s PMI rising to 51.4 compared to September’s 51.1
Closer to home, the ISM report for October showed a climb to 56.4, comfortably above the 50 demarcation line between expansion and contraction. Nevertheless, the environment looks tricky as the budget ceiling debate/government showdown is set to resume shortly and economic growth remains anemic.
Consumer confidence fell to to 71.2 from last month’s 80.2, widely missing expectations, and U.S. home sales tumbled 5.6%.
Nevertheless, major indexes posted strong October results with the Dow Jones Industrial Average (DIA) gaining 2.7% and the SP500 (SPY) adding 4.3%.
Next week will see a tidal wave of important economic reports including:
Monday: September Factory Orders
Tuesday: October ISM Services
Wednesday: September Leading Economic Indicators
Thursday: weekly jobless claims, Q3 GDP report
Friday: October Non Farm Payrolls and unemployment, September income and spending, University of Michigan Consumer Sentiment
Earnings report will also continue, however, many of the high profile, bellwether companies have already reported.
The Dow Jones Industrial Average (DIA) and other major U.S. indexes consolidate just below recent highs as investors look for a reason to take prices higher as the global economy remains tepid and a new political budget battle looms just ahead.
Disclaimer: The content included herein is for educational and informational purposes only, and readers agree to Wall Street Sector Selector's Disclaimer, Terms of Use, and Privacy Policy before accessing or using this or any other publication by Wall Street Sector Selector or Ridgeline Media Group, LLC.
- English (UK)
- English (India)
- English (Canada)
- English (Australia)
- English (South Africa)
- English (Philippines)
- English (Nigeria)
- Deutsch
- Español (España)
- Español (México)
- Français
- Italiano
- Nederlands
- Português (Portugal)
- Polski
- Português (Brasil)
- Русский
- Türkçe
- العربية
- Ελληνικά
- Svenska
- Suomi
- עברית
- 日本語
- 한국어
- 简体中文
- 繁體中文
- Bahasa Indonesia
- Bahasa Melayu
- ไทย
- Tiếng Việt
- हिंदी
Dow Jones Industrial Average: Overextended And Overloved
Published 11/04/2013, 12:06 AM
Updated 05/14/2017, 06:45 AM
Dow Jones Industrial Average: Overextended And Overloved
Latest comments
Install Our App
Risk Disclosure: Trading in financial instruments and/or cryptocurrencies involves high risks including the risk of losing some, or all, of your investment amount, and may not be suitable for all investors. Prices of cryptocurrencies are extremely volatile and may be affected by external factors such as financial, regulatory or political events. Trading on margin increases the financial risks.
Before deciding to trade in financial instrument or cryptocurrencies you should be fully informed of the risks and costs associated with trading the financial markets, carefully consider your investment objectives, level of experience, and risk appetite, and seek professional advice where needed.
Fusion Media would like to remind you that the data contained in this website is not necessarily real-time nor accurate. The data and prices on the website are not necessarily provided by any market or exchange, but may be provided by market makers, and so prices may not be accurate and may differ from the actual price at any given market, meaning prices are indicative and not appropriate for trading purposes. Fusion Media and any provider of the data contained in this website will not accept liability for any loss or damage as a result of your trading, or your reliance on the information contained within this website.
It is prohibited to use, store, reproduce, display, modify, transmit or distribute the data contained in this website without the explicit prior written permission of Fusion Media and/or the data provider. All intellectual property rights are reserved by the providers and/or the exchange providing the data contained in this website.
Fusion Media may be compensated by the advertisers that appear on the website, based on your interaction with the advertisements or advertisers.
© 2007-2024 - Fusion Media Limited. All Rights Reserved.