Friday action leaves Dow Jones Industrial Average down for January and with a “sell” signal
As January drew to a close, the Dow Jones Industrial Average (DIA) and other major global stock market indexes registered losses for the month.
U.S. stocks posted a down week and a down January as investors fretted over poor earnings reports, weakness in emerging markets and the ongoing tapering of the Federal Reserve’s bond buying program.
For the month, the Dow Jones Industrial Average (DIA) lost 5.2%, the Nasdaq (QQQ) dipped 1.7% and the SP500 (SPY) gave up 3.6%.
Overall, a down January can be a bad omen for stock markets as the StockTraders Almanac’s “January Barometer” says that “as goes January, so goes the year.”
The earnings season thus far has been mediocre, at best, and Amazon (AMZN) continued the parade of weaker than expected reports on Friday with the stock falling 11%.
Emerging markets and Europe were also weak with iShares Emerging Market ETF (EEM) falling 7.9% for the month and iShares MSCI EAFE (EFA) 5.4% off late 2014 highs.
On My Stock Market Radar
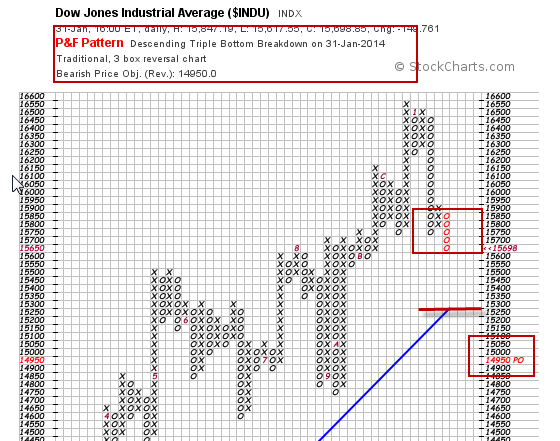
The Dow Jones Industrial Average (DIA) shows significant technical damage as a result of January’s action.
In the point and figure chart below, we can see that the Dow Jones Industrial Average (DIA) registered a new “sell” signal on Friday with a bearish price objective of 14,950, approximately 4.7% below current levels. A drop below the blue line at the 15,250 level would indicate a larger correction and the start of a new bear market according to point and figure charting methodology.

A drop below the 200 day average is likely to trigger intensified selling as that level is widely viewed as the demarcation line between bull and bear markets and the point at which many large market participants begin sheltering/hedging/selling positions.
Stock Market News You Can Really Use
Investors remain concerned about economic weakness in China and emerging markets (EEM) as well as the Federal Reserve tapering program which continued last week with a $10 billion reduction in Federal Reserve bond buying activity. No one knows for sure what the impact of this reduction will be, but clearly, emerging markets and emerging market currencies reacted extremely negatively to the news.
At home, earnings continued to disappoint with Amazon missing estimates and Wal-Mart (WMT) downgrading its Q4 earnings forecast.
Chevron (CVX) Mastercard (MA) and Mattel (MAT) also joined the litany of weak earnings reports, joining the likes of Google, Apple, Exxon Mobil and Yahoo (YHOO) which posted various earnings, sales and revenue disappointments.
The news wasn’t all bad, however, as Ford (F) reported a good year, along with Facebook and UPS.
In economic reports, Q4 GDP recorded a decent 3.2% and US PMI rose to 56.6, along with home prices posting a gain in November.
Pending and new home sales didn’t fare so well, with new home sales recording 414,000 for December, well below expectations of 455,000.
Pending home sales for December fell 8.7% compared to a gain of 0.2% the previous month, and Durable Goods were frozen in December with a decline of 4.3%, widely off expectations of a gain of 1.6%.
China spooked the world with its PMI falling below 50 and into contraction territory with the Shanghai Composite (FXI) falling almost 10% from its early December recent highs.
Next week brings significant economic news:
Monday: January ISM, December Construction spending
Wednesday: ADP Employment, ISM Services
Thursday: weekly jobless claims
Friday: January Non Farm Payrolls, Unemployment
Of course, the big item here will be Friday’s employment report.
In earnings, closely watched companies include:
Monday: Yum! Brands (YUM)
Tuesday: Toyota (TM)
Wednesday: Merck, (MERK) Time Warner, (TWX) Twitter, (TWTR) Walt Disney, (DIS) Yelp (YELP)
Thursday: AOL, (AOL) General Motors, (GM) Sony, (SE) LinkedIn (LNKD)
Bottom line: The Dow Jones Industrial Average (NYSERCA:DIA) and other major global indexes will have to continue to cope with the withdrawal of Federal Reserve stimulus along with signs of a slowdown in China and weaker than expected earnings in the United States. More volatility can be expected.
Disclaimer: The content included herein is for educational and informational purposes only, and readers agree to Wall Street Sector Selector's Disclaimer, Terms of Use, and Privacy Policy before accessing or using this or any other publication by Wall Street Sector Selector or Ridgeline Media Group, LLC.
