Get 40% Off
🚨 Volatile Markets? Find Hidden Gems for Serious OutperformanceFind Stocks Now

Dow Jones Averages And MSCI ACWI: Correction Likely

Published 01/31/2016, 04:52 AM
Updated 07/09/2023, 06:31 AM

There are discussions right now if last few week's sell-off was another failed breakdown. Was this another bear trap? Did Central Banks again manage to put a floor to equity markets? ECB's dovish comments and BOJ's negative interest rate moves both came this month, after sharp sell-off in equity markets.

Due to developing bearish chart patterns and the fact that major indices are below their long-term averages I'm weighing the possibility of a correction more than a strong bull market in the coming months. This time could be different and the technical outlook might prove to be a bear trap. I'm fine with that. That's what markets are. Current chart set-up is something that I can't ignore and I'll try to explain here.

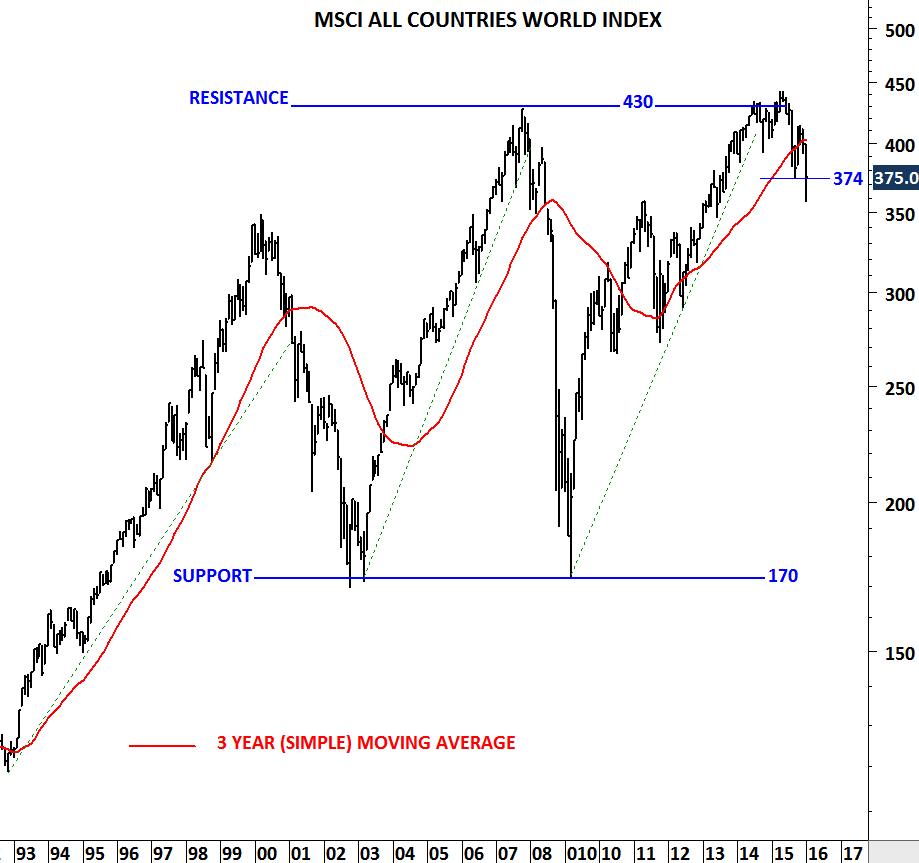
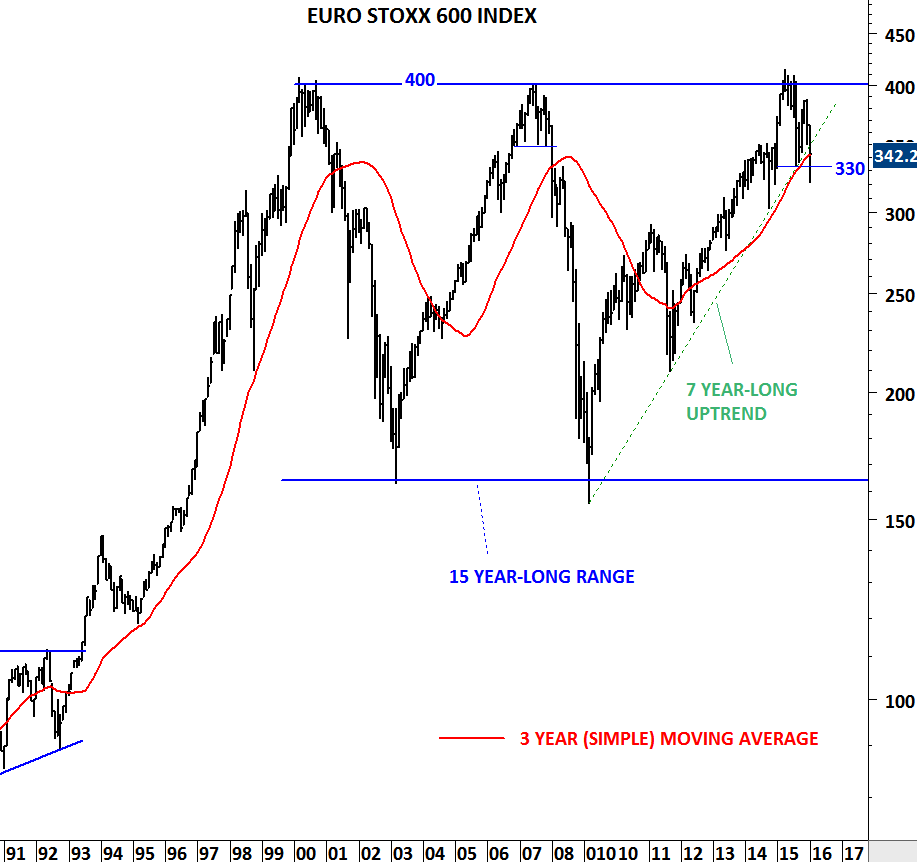
First let's look at two major equity indices that we have been following. On a monthly scale "close" was at the border. The jury is still out in my opinion. Though, I would say last week of the month we have seen a good attempt to close at the higher levels for the month.

MSCI All Countries Index Chart
Euro Stoxx 600 Chart

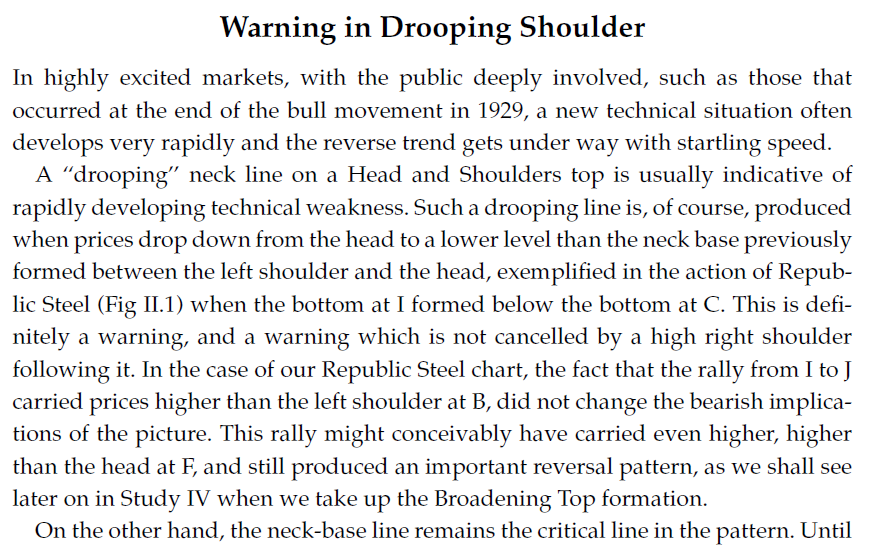
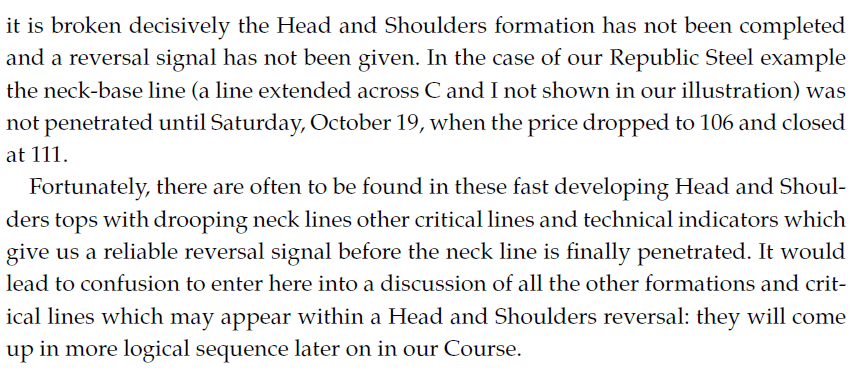
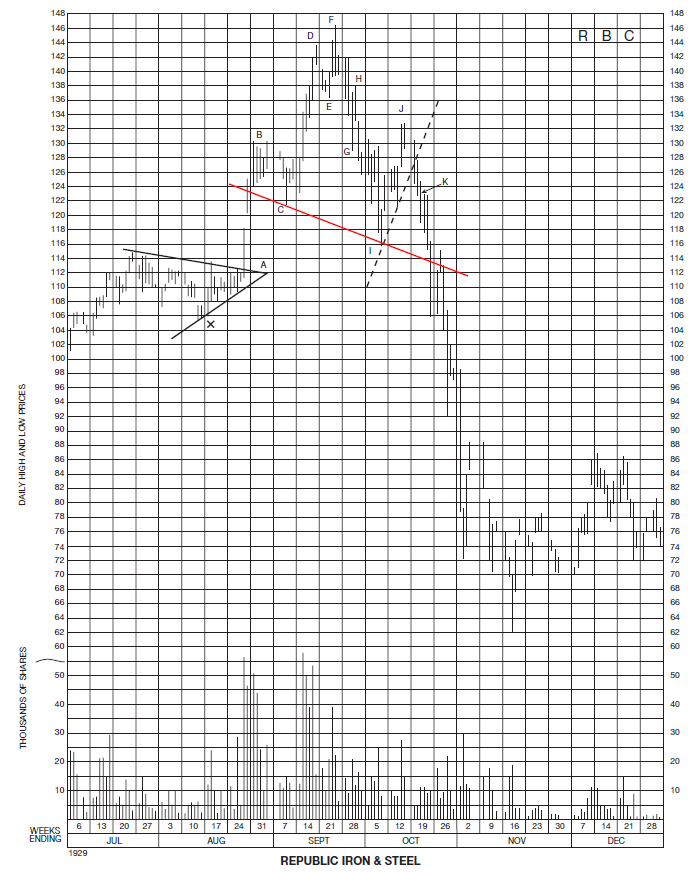
Richard W. Schabacker in his book TECHNICAL ANALYSIS AND STOCK MARKET PROFITS (Printed in US in 1932) discusses Important Reversal Formations. Under this section there is a detailed study of Head and Shoulder reversal chart patterns. We are all familiar with the Head and Shoulder chart pattern. I want to draw attention to a specific type that we are seeing right now on equity index charts. Schabacker explains:

3rd party Ad. Not an offer or recommendation by Investing.com. See disclosure here or remove ads .
Book Excerpt
Book Excerpt

Here is the chart he was analyzing at the time. Please note that the original chart doesn't include the red trend line (neckline). I added this to show the similarities with the current chart patterns.

Republic Iron and Steel Chart

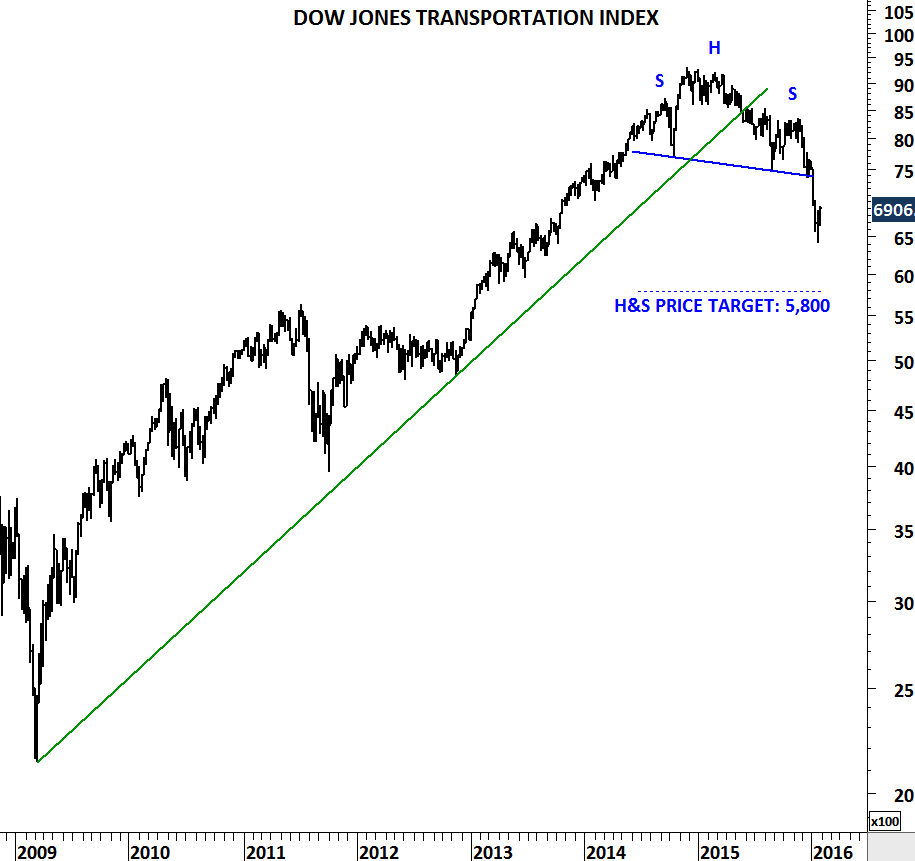
Several decades later similar chart patterns are appearing on the widely followed and traded equity indices. Dow Jones Transportation Index broke down a similar downward sloping trend line. Head and shoulder price target is at 5,800 levels, still far from current 6,906 levels.

DJT Chart

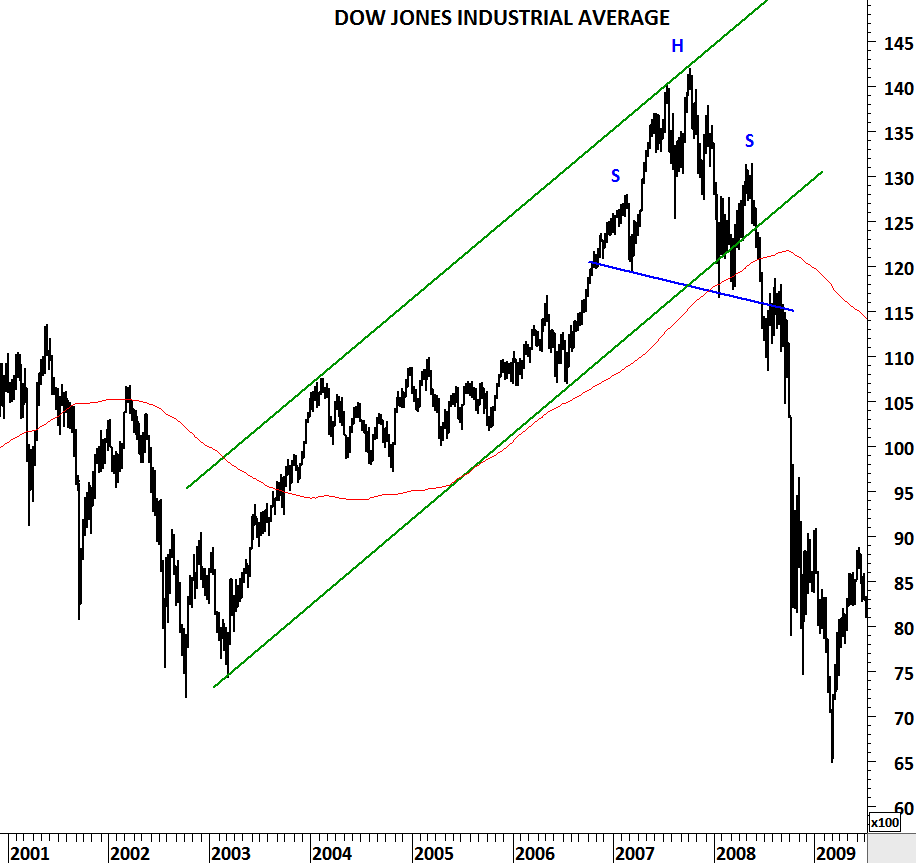
Now let's look at some similarities between 2008 and 2016. In 2008, Dow Jones Industrial Average reversed its 4 year-long uptrend with a Head & Shoulder top. Neckline was downward slanting. After the breakdown there was a pullback that violated the neckline but couldn't push above the long-term average or inside the trend channel. The head and shoulder top that formed in 2007-2008 showed significant market weakness due to its drooping shoulder.

Dow Jones Daily Chart

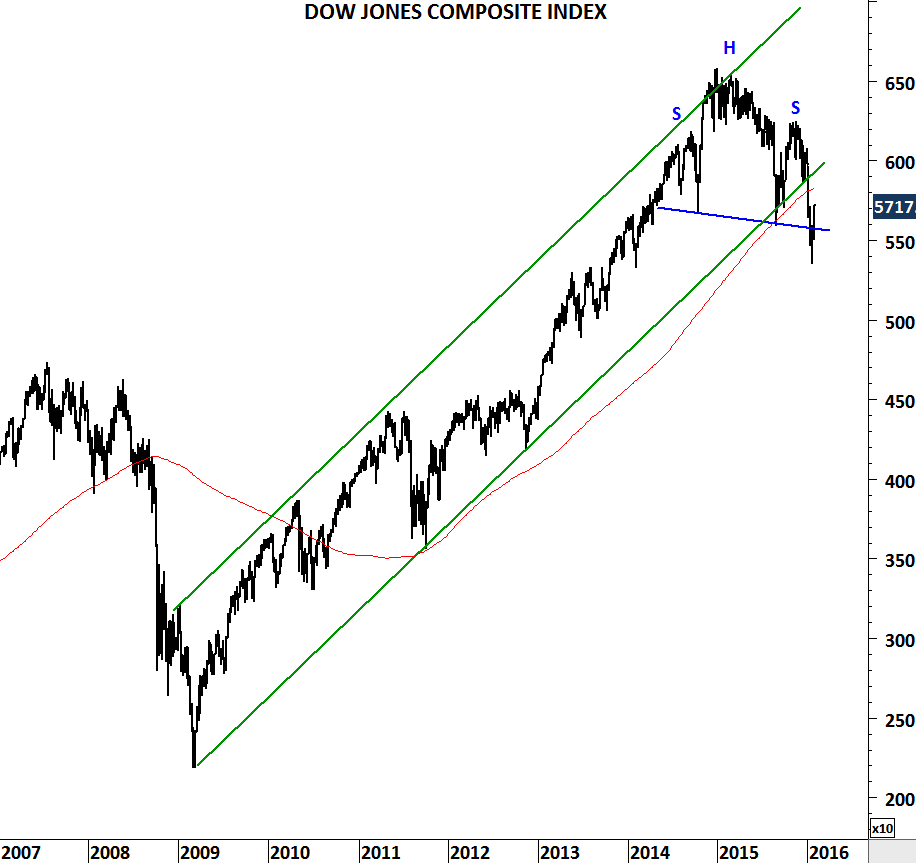
Dow Jones Composite Average is now forming a similar Head and Shoulder top with downward sloping neckline. Both the long-term moving average and the lower boundary of the 6 year-long trend channel is violated. If this time is not different, current chart set-up suggests a correction is more likely in the following months than the continuation of the bull market.

Dow Jones Composite Average Chart

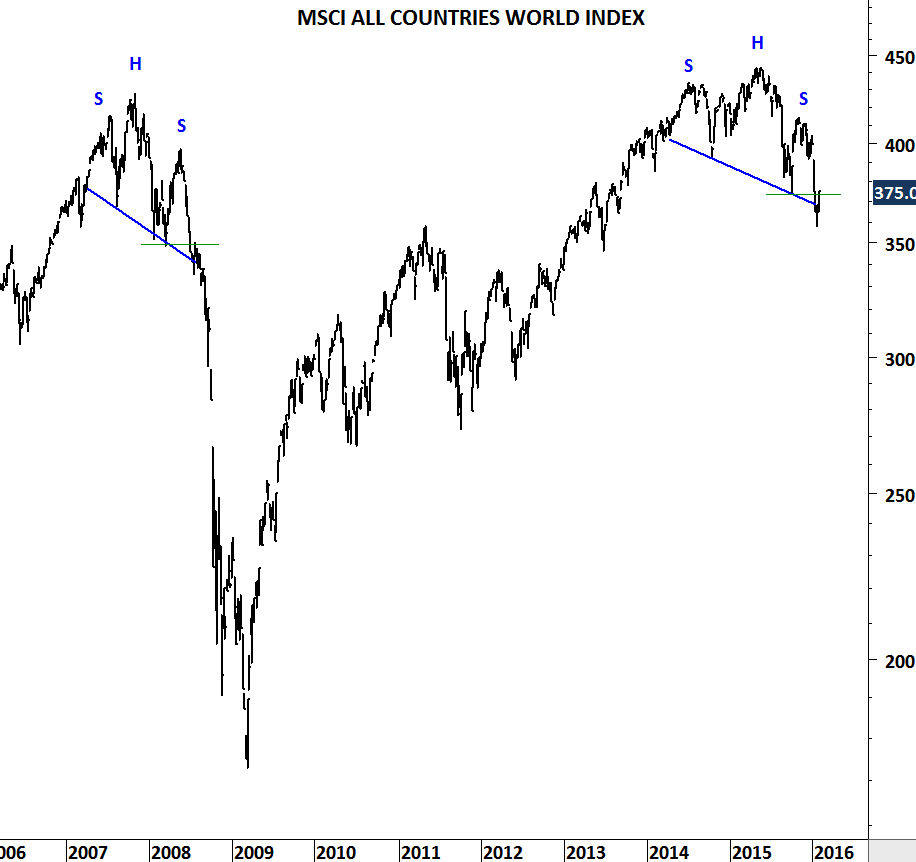
We can also look at MSCI ALL COUNTRIES WORLD INDEX and compare the top in 2007-2008 with the latest chart development. I think the current technical conditions can't be ignored. I want to give these markets some more time to prove the bears wrong.

3rd party Ad. Not an offer or recommendation by Investing.com. See disclosure here or remove ads .
MSCI ALL COUNTRIES WORLD INDEX

Latest comments

Risk Disclosure: Trading in financial instruments and/or cryptocurrencies involves high risks including the risk of losing some, or all, of your investment amount, and may not be suitable for all investors. Prices of cryptocurrencies are extremely volatile and may be affected by external factors such as financial, regulatory or political events. Trading on margin increases the financial risks.
Before deciding to trade in financial instrument or cryptocurrencies you should be fully informed of the risks and costs associated with trading the financial markets, carefully consider your investment objectives, level of experience, and risk appetite, and seek professional advice where needed.
Fusion Media would like to remind you that the data contained in this website is not necessarily real-time nor accurate. The data and prices on the website are not necessarily provided by any market or exchange, but may be provided by market makers, and so prices may not be accurate and may differ from the actual price at any given market, meaning prices are indicative and not appropriate for trading purposes. Fusion Media and any provider of the data contained in this website will not accept liability for any loss or damage as a result of your trading, or your reliance on the information contained within this website.
It is prohibited to use, store, reproduce, display, modify, transmit or distribute the data contained in this website without the explicit prior written permission of Fusion Media and/or the data provider. All intellectual property rights are reserved by the providers and/or the exchange providing the data contained in this website.
Fusion Media may be compensated by the advertisers that appear on the website, based on your interaction with the advertisements or advertisers.
© 2007-2024 - Fusion Media Limited. All Rights Reserved.