Get 40% Off
⚠ Earnings Alert! Which stocks are poised to surge?
See the stocks on our ProPicks radar. These strategies gained 19.7% year-to-date.
Unlock full list

Don't Overthink That Chart And Buy Ford

Published 08/28/2014, 02:53 PM
Updated 05/14/2017, 06:45 AM

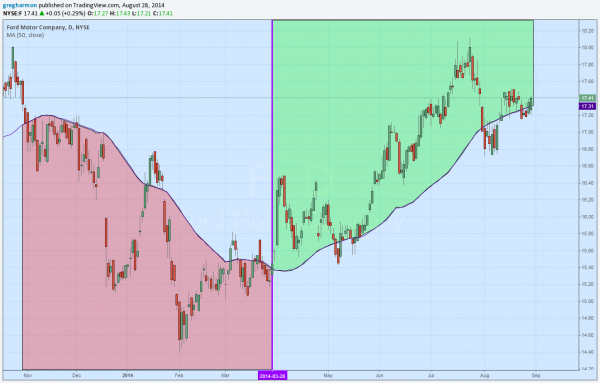
Sometimes charts are made out to be more complicated than they need to be. Lines and colors and arrows pointing every which way. Indicators above and below. There is often some insight to be gained from these, but just as often there is a wealth of information to gather from just a simple view. The chart of Ford Motor Company's (NYSE:F) stock price below is one such example. It is just the price action on a daily basis, the 50-day SMA and a trigger based on them.

Ford's Daily Price Action

What's The Chart Say?

From November through to the end of March, the stock was in a downtrend. You can see that it spent most of its time under the 50-day SMA, in the red area. There were a couple of tests above it but they didn't last long. Then in April, the stock had a change of character and began a trend higher. since then it has spent most of its time above the 50-day SMA, in the green zone. Again, there have been tests below that have failed and the stock has moved higher.

Remember: Red = Downtrend, Green = Uptrend

Very simple chart and an easy one to read. Now, how do you use it? Each of those tests that failed is a potential trigger. As it moves back into the colored zone it is a buy moving into the green; and would have been a short sale moving into the red. The buy signal triggered Wednesday. A more conservative trader might still wait for a move over 17.50 to confirm a break of the previous high.

You see? It's really not all that complicated.

Original Post

Latest comments

Risk Disclosure: Trading in financial instruments and/or cryptocurrencies involves high risks including the risk of losing some, or all, of your investment amount, and may not be suitable for all investors. Prices of cryptocurrencies are extremely volatile and may be affected by external factors such as financial, regulatory or political events. Trading on margin increases the financial risks.
Before deciding to trade in financial instrument or cryptocurrencies you should be fully informed of the risks and costs associated with trading the financial markets, carefully consider your investment objectives, level of experience, and risk appetite, and seek professional advice where needed.
Fusion Media would like to remind you that the data contained in this website is not necessarily real-time nor accurate. The data and prices on the website are not necessarily provided by any market or exchange, but may be provided by market makers, and so prices may not be accurate and may differ from the actual price at any given market, meaning prices are indicative and not appropriate for trading purposes. Fusion Media and any provider of the data contained in this website will not accept liability for any loss or damage as a result of your trading, or your reliance on the information contained within this website.
It is prohibited to use, store, reproduce, display, modify, transmit or distribute the data contained in this website without the explicit prior written permission of Fusion Media and/or the data provider. All intellectual property rights are reserved by the providers and/or the exchange providing the data contained in this website.
Fusion Media may be compensated by the advertisers that appear on the website, based on your interaction with the advertisements or advertisers.
© 2007-2024 - Fusion Media Limited. All Rights Reserved.