Upcoming US Events for Today:
- Housing Starts for August will be released at 8:30am. The market expects 1.038M versus 1.093M previous.
- Weekly Jobless Claims will be released at 8:30am. The market expects 305K versus 315K previous.
- Philadelphia Fed Survey for September will be released at 10:00am. The market expects 23.0 versus 28.0 previous.
Upcoming International Events for Today:
- Great Britain Retail Sales for August will be released at 4:30am EST. The market expects a year-over-year increase of 4.2% versus an increase of 2.6% previous.
The Markets
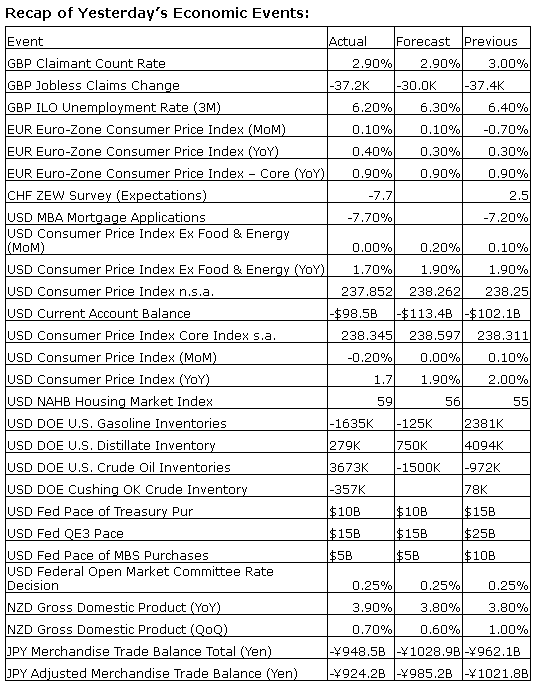
Stocks ended mixed on Wednesday as investors reacted to the recent policy statement from the Fed. Stocks initially jumped higher around the announcement when it was confirmed that the Fed maintained its language pertaining to keeping rates near zero for a “considerable time.” However, selling pressures in the late afternoon pushed a number of sectors into the red, dragging broad market indices closer to the flatline. As expected, the committee reduced asset purchases by an additional $10 Billion to a total of $15 Billion per month and is on track to complete the QE3 asset purchase program after its next meeting. Investors will be watching closely to see if equity markets can finally stand on their own given that the reaction to the conclusion of asset purchases following QE1 in 2010 and QE2 in 2011 led to declines in the S&P 500 Index of around 16% and 21%, respectively.
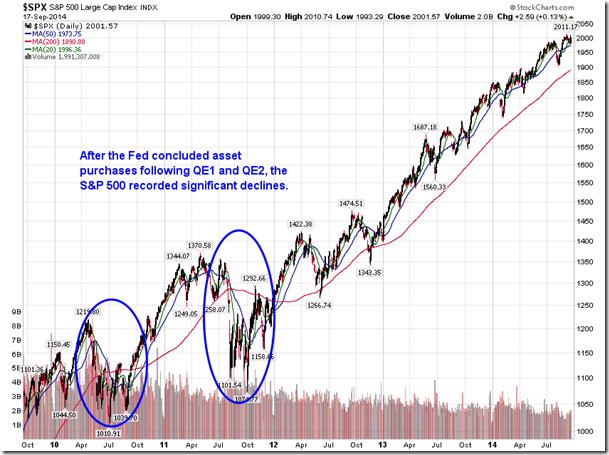
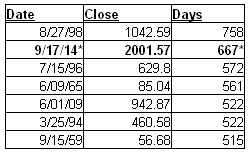
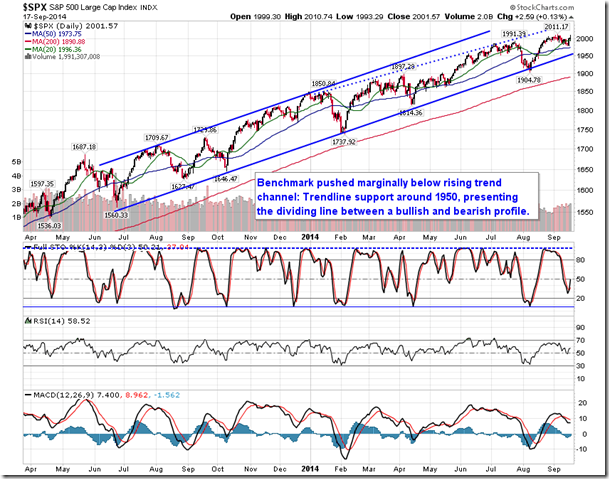
As may be apparent by the chart above, the S&P 500 has gone a substantial period of time without testing is 200-day moving average. At 667 days (and counting), this is the second longest range of time that the large cap benchmark has gone without testing its 200-day moving average line, based upon daily closing values. The longest span of time ran 758 days and concluded on August 27, 1998 when the S&P 500 Index plunged around 20%, from peak to trough, over the course of just a few months. The average number of days between subsequent tests of the long term moving average, based on data over the past 60 years, is only 59.5 days, making the current stretch extremely significant. Needless to say, a test of the 200-day moving average, currently at 1891, is long overdue.
Top 7 Longest Runs Without a Test of the 200-Day Moving Average:
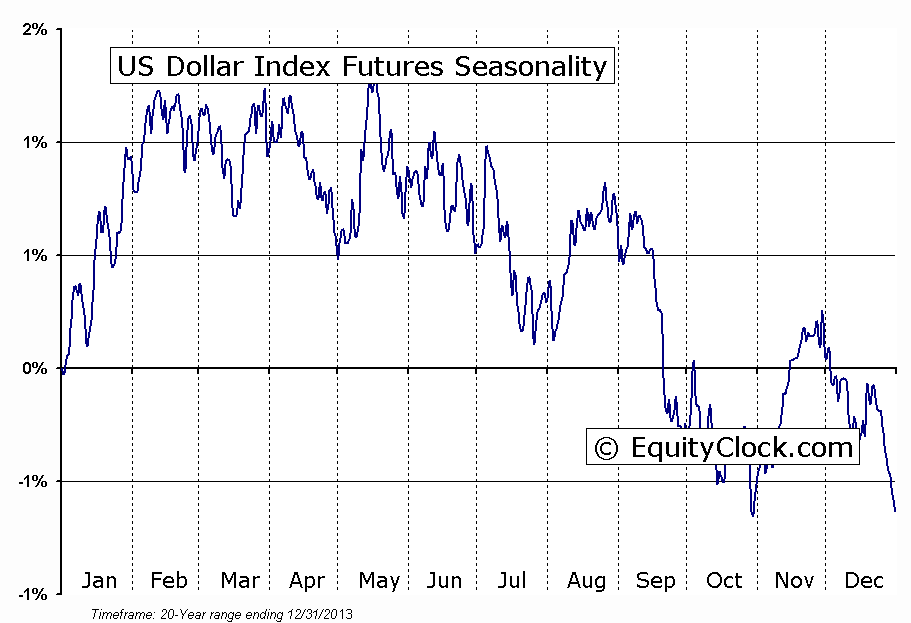
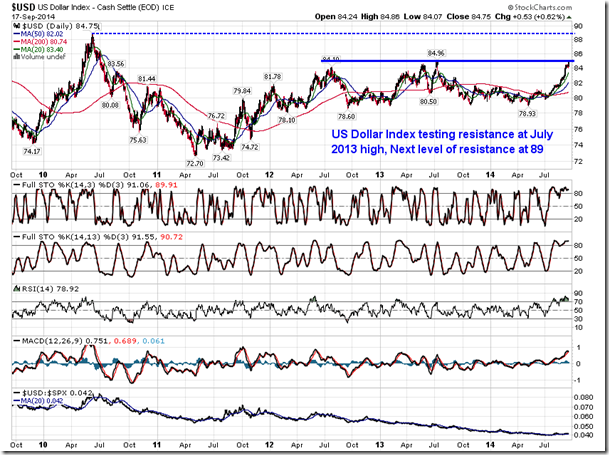
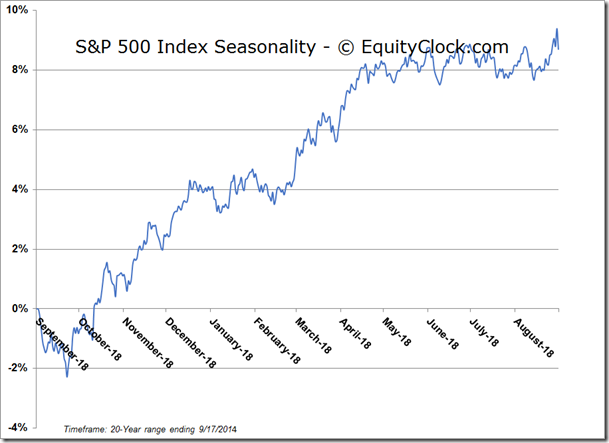
Perhaps the more notable move during Wednesday’s session was within the US Dollar Index, which surged to the highest level in 14 months. The US Dollar Index is now threatening resistance at the July 2013 highs as currency investors start to believe in the Fed’s tightening schedule. A breakout above 85 on the US Dollar Index would lead to a test of the 2009 and 2010 highs around 89, likely pressuring commodity prices in the process. Activity in the US Dollar continues to act contrary to seasonal trends for this time of year, which call for a lower currency through to the end of October.
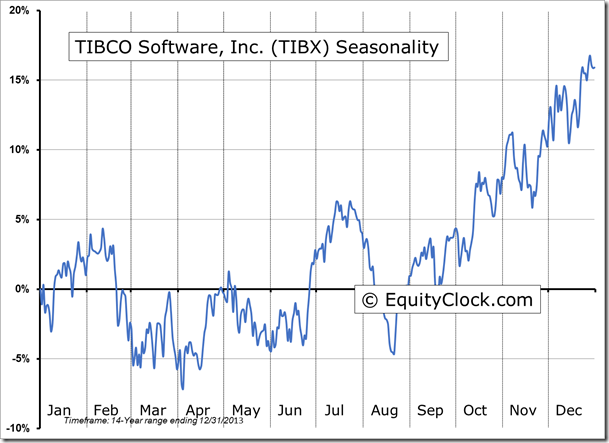
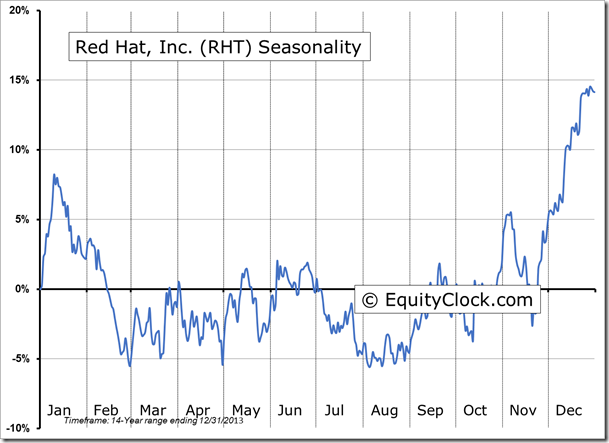
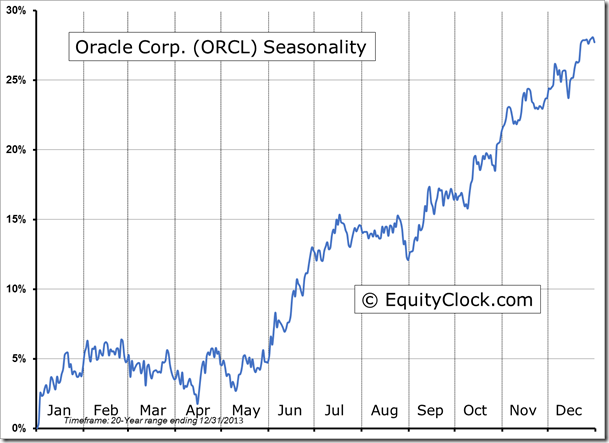
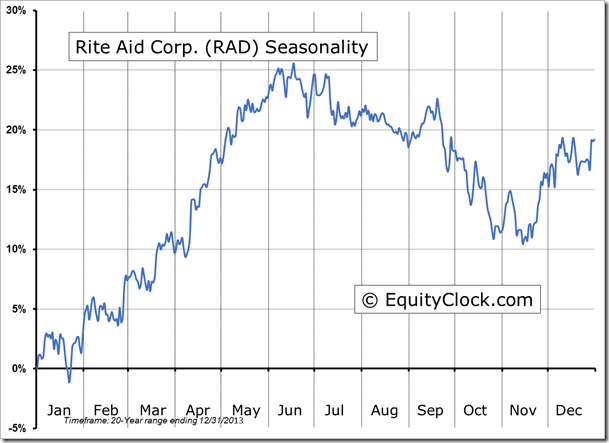
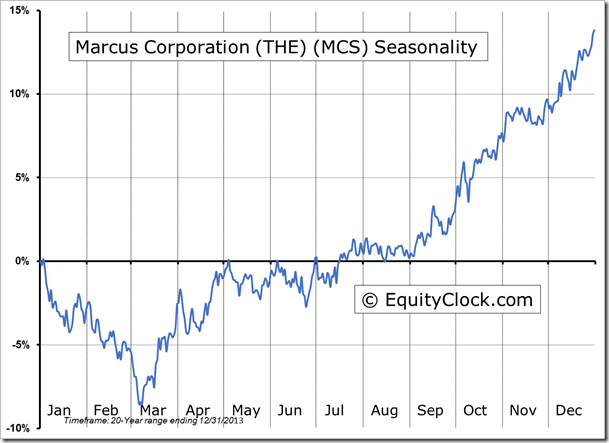
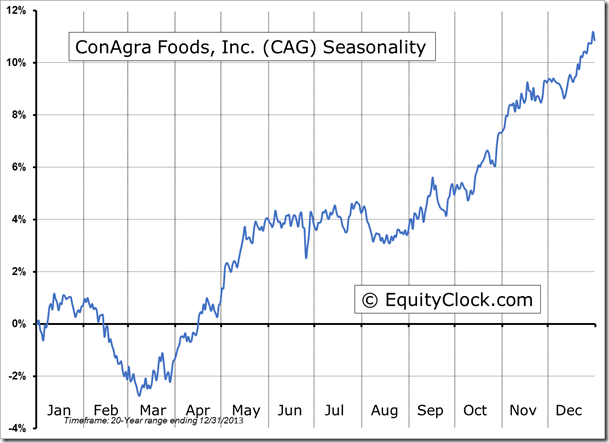
Seasonal charts of companies reporting earnings today:
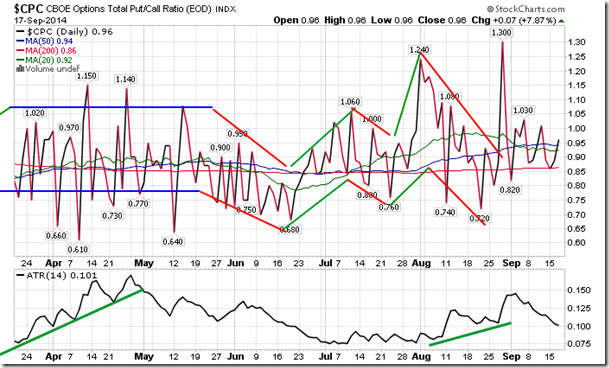
Sentiment on Wednesday, as gauged by the put-call ratio, ended close to neutral at 0.96.
S&P 500 Index
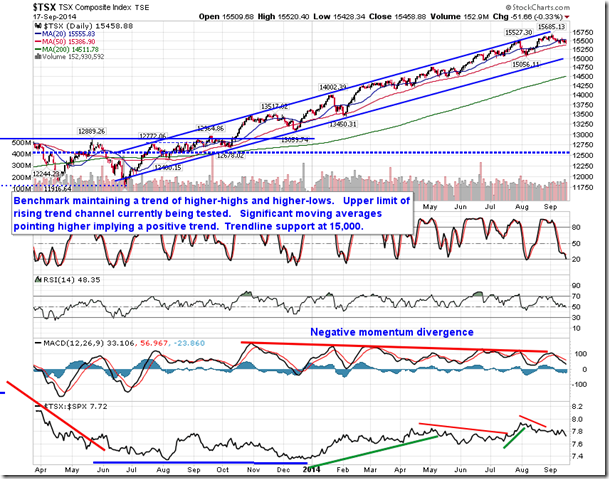
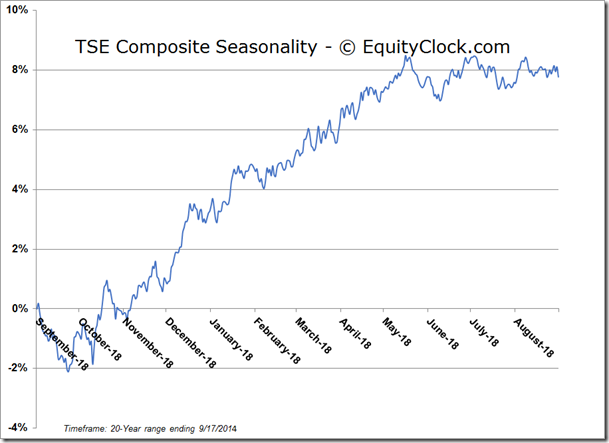
TSE Composite
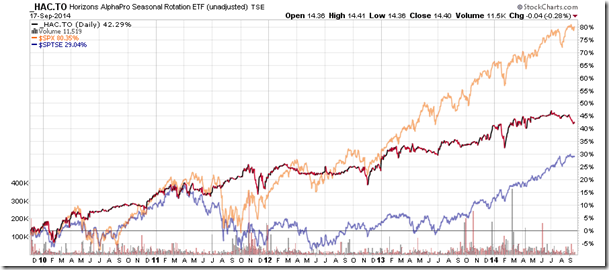
Horizons Seasonal Rotation ETF (TSX:HAC)
- Closing Market Value: $14.40 (down 0.28%)
- Closing NAV/Unit: $14.38 (down 0.29%)
Performance*
| 2014 Year-to-Date | Since Inception (Nov 19, 2009) | |
| HAC.TO | 0.56% | 43.8% |
* performance calculated on Closing NAV/Unit as provided by custodian
