Being the last trading of September, we can comfortably look back and see who how strongly the US Dollar has been performing this last month against the other majors as a whole. Back in early September, I wrote in the column ‘The era of the US Dollar has truly come’, about how the market was reassuring as leaving little doubt to the return to trend. The golden advice of trading where “a trend is a friend” stays true. While we see no signs of reversal on the Dollar yet, the best strategy now would still be to follow the trend.
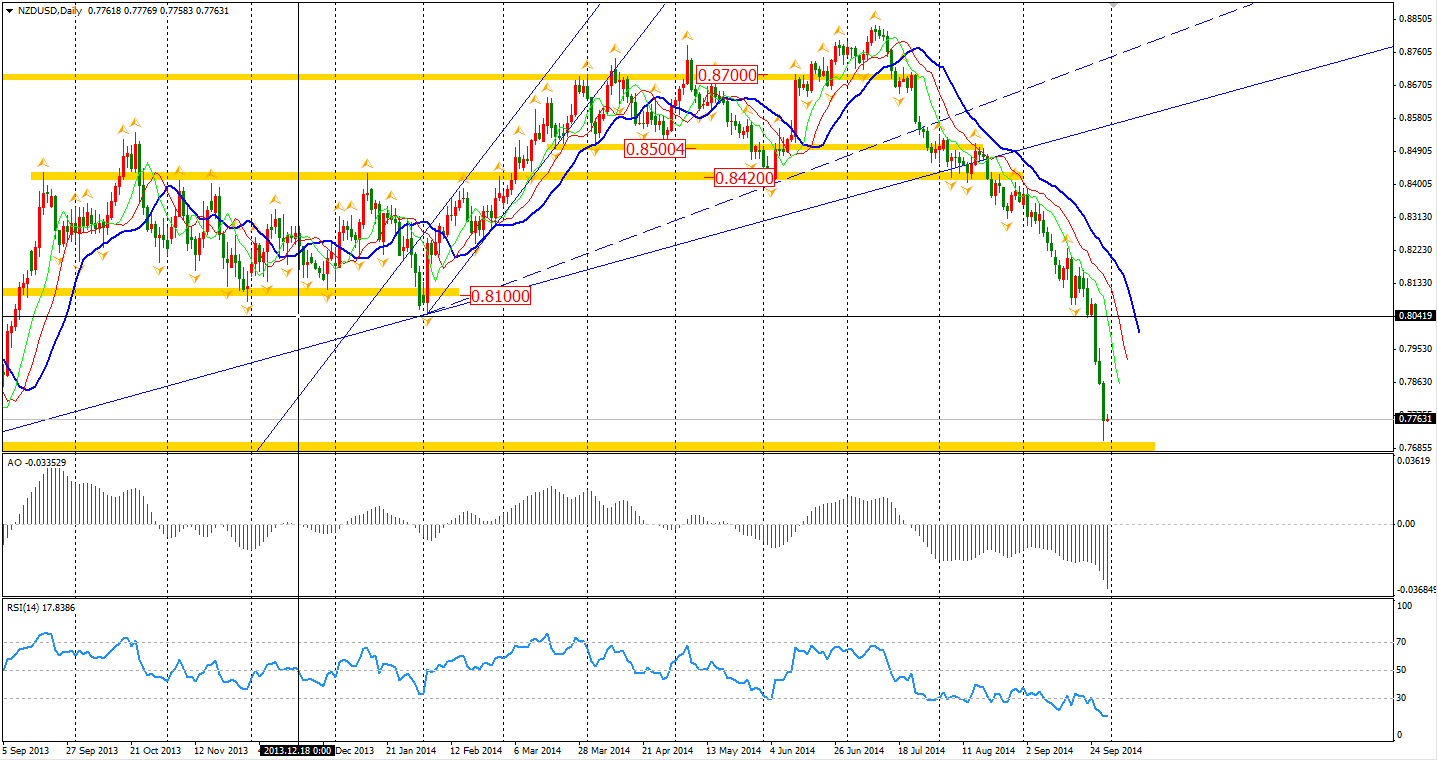
The New Zealand dollar was the weakest major currency yesterday, falling 1.3% against the US Dollar. In the Asian Monday morning session, the RBNZ disclosed that the central bank had intervened in the forex market in August selling a net of NZ$521 million – the highest amount in seven years. The Kiwi/Dollar dropped to a day low of 0.7709 after the news. The RBNZ thinks the fair level should be 0.65 yet it seems like the fall won’t be over in the middle run.
Just like how carry trade strategies would fail as volatility returns, will the global stock market bull trend stop as the economy slows down and higher risk is making some investors withdraw their investments?
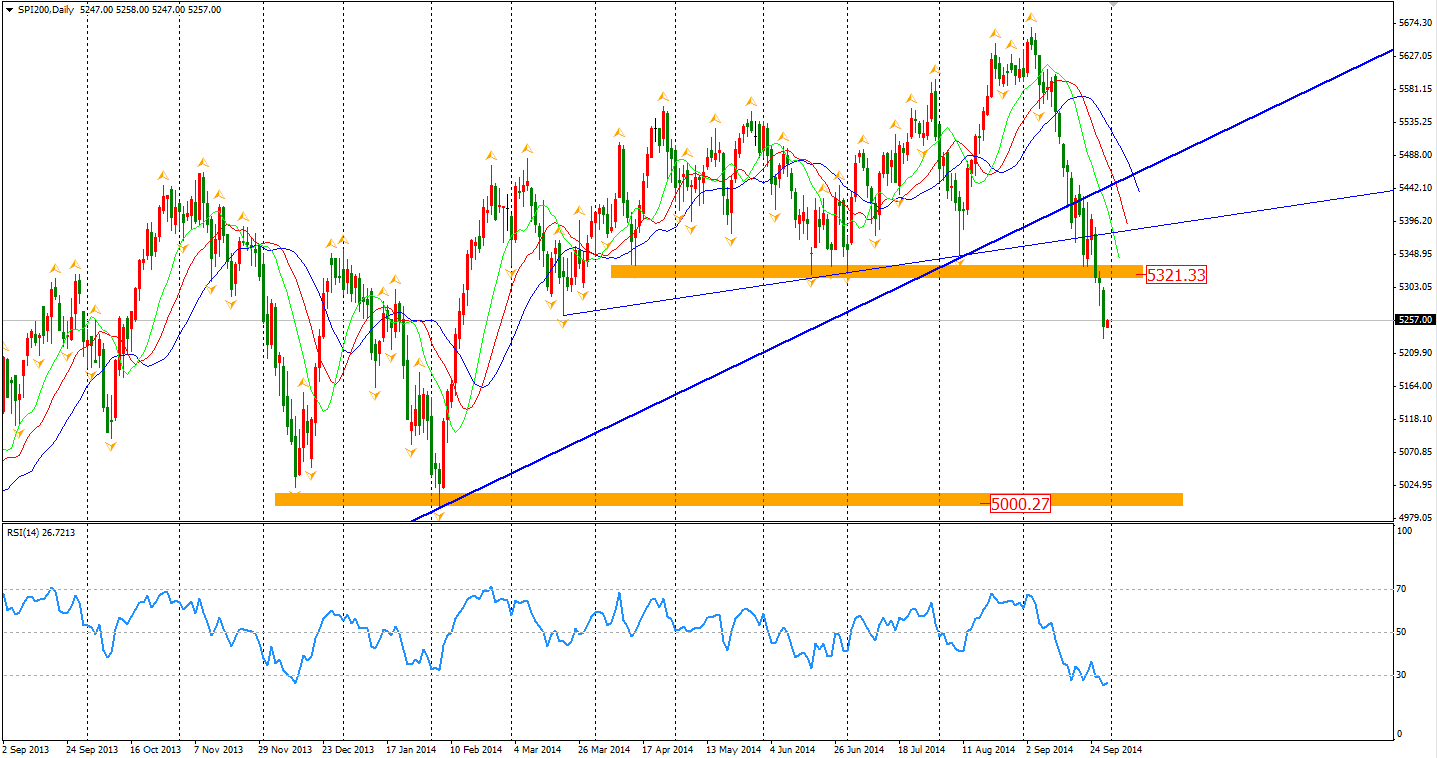
The Australian ASX 200 slumped by 0.93% to 5264. The index has already broken the bullish trendline formed since mid-2012 and also the support near 5320. From a technical view, it is heading towards the year’s low 5000 integer level.
In other Asian stock markets, the Shanghai Composite moved by 0.43% up to 2357. The Nikkei Stock Average rebounded by 0.5%. In European stock markets, the UK FTSE was down 0.04%, the German DAX lost 0.71% and the French CAC Index fell 0.83%. U.S. stocks continued the weakness. The S&P 500 lost 0.25% to 1978. The Dow edged down 0.25% to 17071, while the NASDAQ Composite Index dropped 0.14% to 4506.
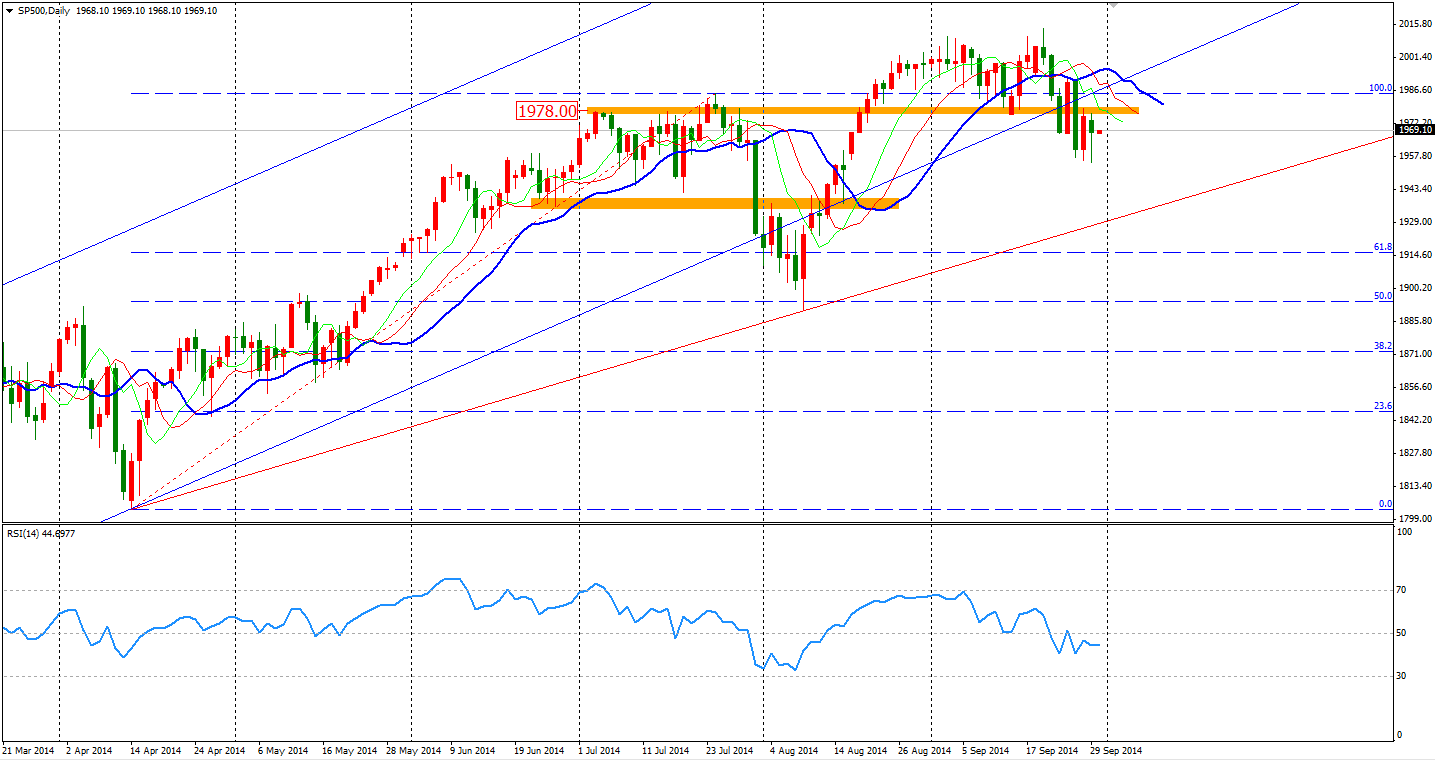
We also saw a reverse sign for the S&P 500 as it failed to rise back to the area beyond the 1978 level. A bottom top pattern has revealed itself in the daily chart.
For the data front, the UK Current Account and Unemployment Rate will be closely watched at 18:30. The Eurozone CPI and Unemployment Rate will be 30 minutes after this. At the beginning of US trading hours, the Canada GDP and US CB Consumer Confidence will be released.
Have a great trading day!
Anthony
- English (UK)
- English (India)
- English (Canada)
- English (Australia)
- English (South Africa)
- English (Philippines)
- English (Nigeria)
- Deutsch
- Español (España)
- Español (México)
- Français
- Italiano
- Nederlands
- Português (Portugal)
- Polski
- Português (Brasil)
- Русский
- Türkçe
- العربية
- Ελληνικά
- Svenska
- Suomi
- עברית
- 日本語
- 한국어
- 简体中文
- 繁體中文
- Bahasa Indonesia
- Bahasa Melayu
- ไทย
- Tiếng Việt
- हिंदी
Dollar Bulls Remain, But What's Happening To The Kiwi?
Published 09/29/2014, 09:31 PM
Updated 07/09/2023, 06:31 AM
Dollar Bulls Remain, But What's Happening To The Kiwi?
3rd party Ad. Not an offer or recommendation by Investing.com. See disclosure here or
remove ads
.
Latest comments
Install Our App
Risk Disclosure: Trading in financial instruments and/or cryptocurrencies involves high risks including the risk of losing some, or all, of your investment amount, and may not be suitable for all investors. Prices of cryptocurrencies are extremely volatile and may be affected by external factors such as financial, regulatory or political events. Trading on margin increases the financial risks.
Before deciding to trade in financial instrument or cryptocurrencies you should be fully informed of the risks and costs associated with trading the financial markets, carefully consider your investment objectives, level of experience, and risk appetite, and seek professional advice where needed.
Fusion Media would like to remind you that the data contained in this website is not necessarily real-time nor accurate. The data and prices on the website are not necessarily provided by any market or exchange, but may be provided by market makers, and so prices may not be accurate and may differ from the actual price at any given market, meaning prices are indicative and not appropriate for trading purposes. Fusion Media and any provider of the data contained in this website will not accept liability for any loss or damage as a result of your trading, or your reliance on the information contained within this website.
It is prohibited to use, store, reproduce, display, modify, transmit or distribute the data contained in this website without the explicit prior written permission of Fusion Media and/or the data provider. All intellectual property rights are reserved by the providers and/or the exchange providing the data contained in this website.
Fusion Media may be compensated by the advertisers that appear on the website, based on your interaction with the advertisements or advertisers.
© 2007-2024 - Fusion Media Limited. All Rights Reserved.
