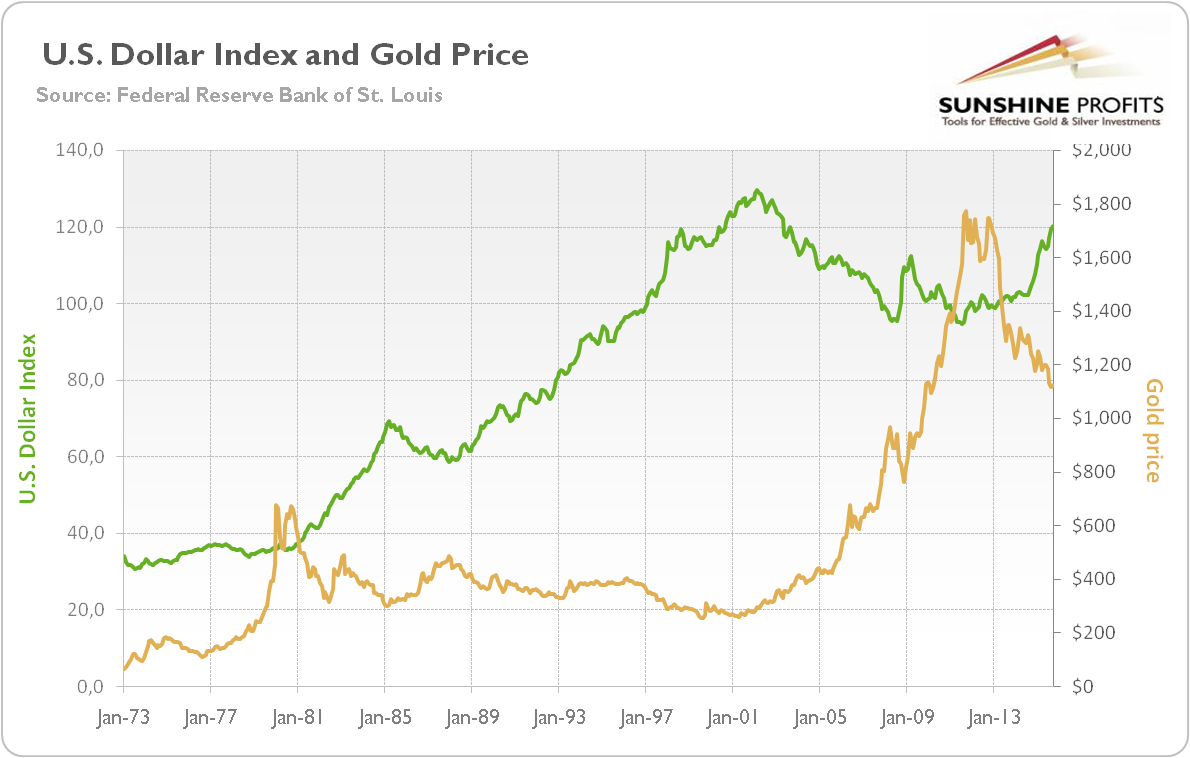
The price of gold is determined mainly through changes in the general level of confidence in the Fed and the U.S. economy. This is why the U.S. dollar exchange rate (and the Forex market in general) has such strong influence on the yellow metal. As one can see in the chart below, gold is leveraged to the misfortune of major global fiat money. Each time confidence in the U.S. dollar increases, like in the 1980s and 1990s, the attractiveness of gold declines. Conversely, each time the U.S. economy and its currency prospects stumble, people are reminded of the extraordinary properties of gold.
Chart 1: Trade Weighted Broad U.S. dollar index (green line, left scale) and the price of gold (yellow line, right scale, London P.M. Gold Fixing) from January 1973 to August 2015

However, there are other important indicators of confidence in the U.S. economy for the gold market. One of them is the performance of financial stocks. The behavior of banks’ and other financial companies’ stocks reflect confidence in systemic stability. When the Fed eases monetary policy, it lowers interest rates and injects liquidity into the system. Banks eagerly expand credit, creating an economic boom, which later transforms into a speculative bubble. In such an environment, the financial sector thrives, while gold remains on the sidelines. Conversely, during economic hardship (which often starts after Fed’s tightening), people do not want to incur new debts – the vital fluid of the financial sector – and banks face many non-performing loans. Since the current monetary system is based on the financial sector creating money thanks to the fractional reserve privilege, the lack of confidence in the financial sector is connected with diminished trust in the U.S. dollar. Gold returns the favor. This is why the price of gold should be negatively correlated with the financial sector’s performance.
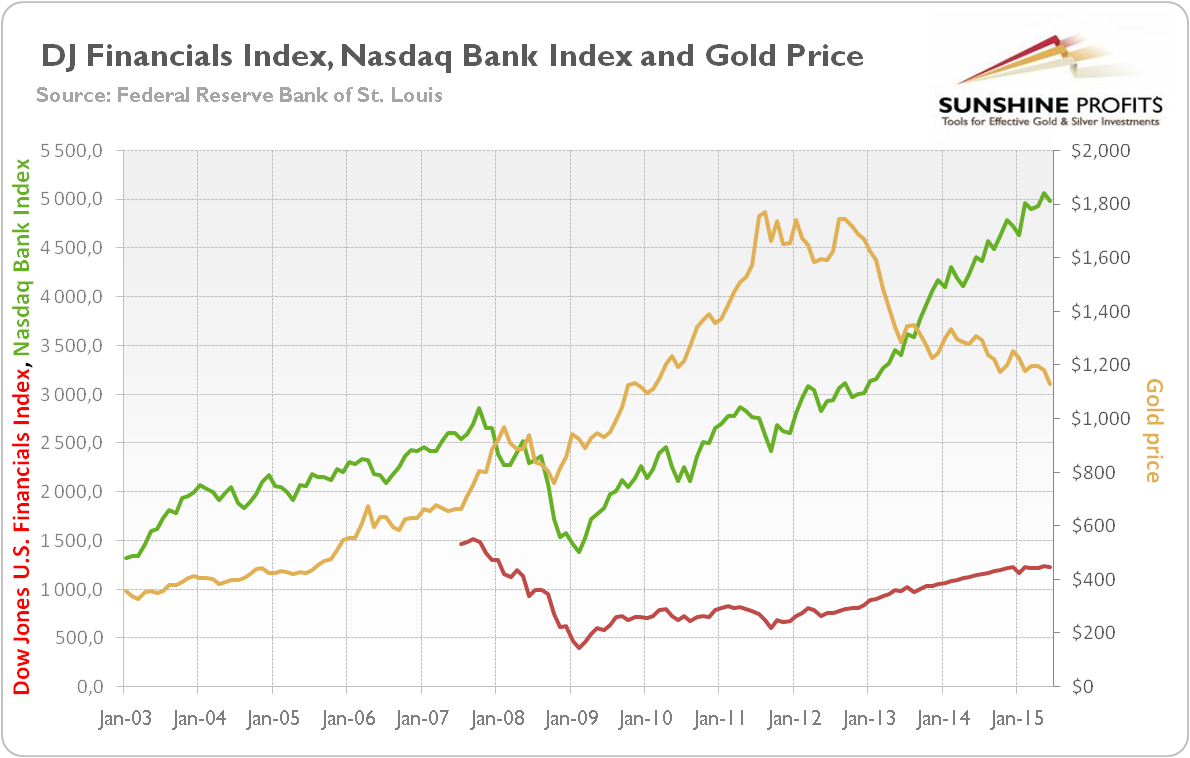
Let’s check whether this is the case. The chart below shows the price of gold and Dow Jones U.S. Financials Index and Nasdaq Bank Index, as proxies of financial sector’s performance.
Chart 2: Dow Jones U.S. Financials Index (red line, left scale), Nasdaq Bank Index (green line, left scale) and the price of gold (yellow line, right scale, London P.M. Gold Fixing) from January 2003 to June 2015

As one can see, there is no one-to-one negative correlation between these indices and the price of gold. However, the shiny metal rallied after 2008, while financial stocks plunged, and reached its peak in 2011, when financial equities started its rebound. Actually, gold looks almost like a mirror image of the Dow Jones U.S. Financials since it peaked in 2011. It partially confirms that gold is primarily an insurance against financial risks. When the fear of a financial disaster waned, financial stocks rose and the price of gold decreased, as gold lost some of its “collapse hedge premium.”
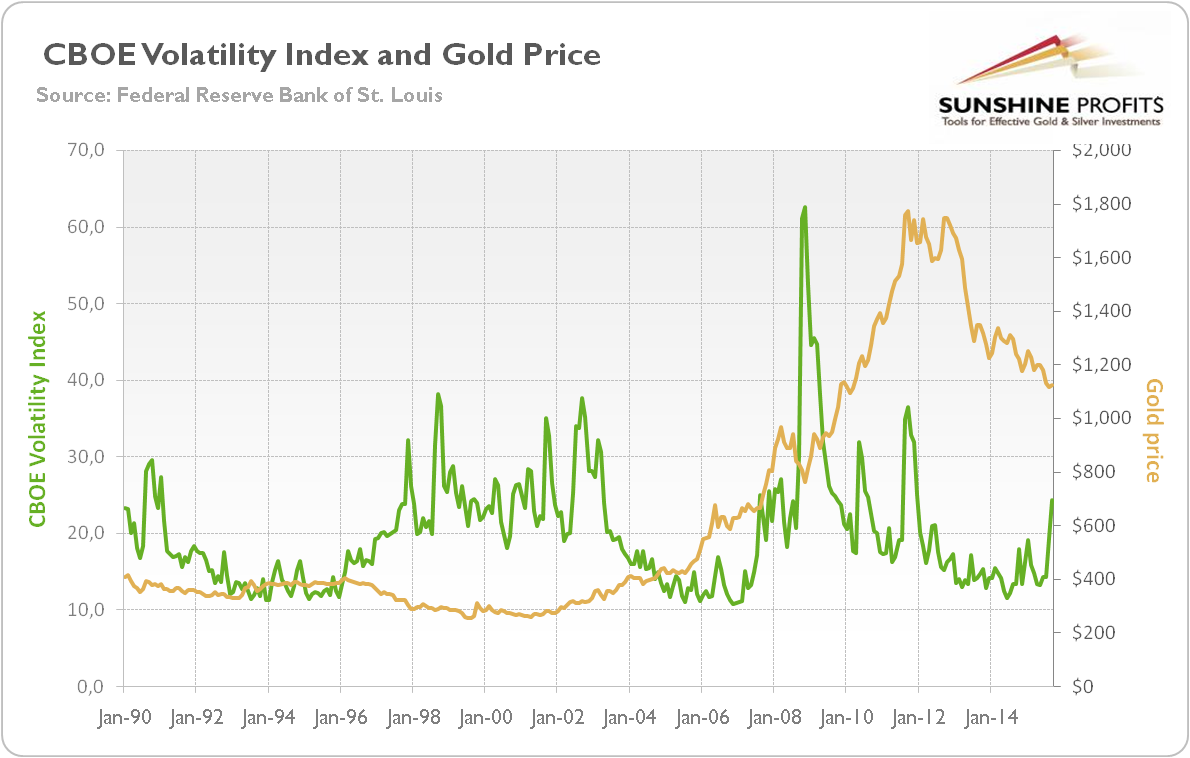
This narrative is supported by the next chart, which shows the price of gold and CBOE Volatility Index. VIX measures market expectation of volatility over the next 30 days conveyed by stock index option prices. Therefore, it should be positively correlated with the gold, a traditional safe-haven.
Chart 3: CBOE Volatility Index (green line, left scale) and the price of gold (yellow line, right scale, London P.M. Gold Fixing) from January 1990 to September 2015

As one can see, the downward trend in the price of gold since 2011 corresponds with the decline in VIX. It confirms our view that the unprecedented central banks’ actions after the outbreak of the Great Recession restored the faith in the global economy and led to the end of the bull market in gold. However, there is no clear relationship between VIX and the price of gold in the whole period (indeed, the volatility index’s correlation to gold price movements between 1990 and 2011 was only about 5 percent). It does not mean that gold is not a safe-haven or inferior safe-haven to VIX. The latter is narrowly linked to the S&P 500, while the price of gold responds to broader systemic tail risks connected to a current monetary system based on the fiat U.S. dollar. Investors should also remember that high VIX means that markets expect high volatility, but not necessarily bearish conditions.
The bottom line is that the price of gold is driven by the confidence of market participants in the government-run monetary system. Of course, it is difficult to quantify the level of faith in the Fed and the U.S. economy. However, there are certain indicators useful for this purpose. One of them is the financial sector’s strength and the expected volatility of the stock market, represented by, correspondingly, the Nasdaq Bank Index and the Dow Jones U.S. Financials Index and the CBOE Volatility index. There is no one-to-one correlation between gold and these indices, but their performance sometimes provides investors with valuable insights.
