Get 40% Off
⚠ Earnings Alert! Which stocks are poised to surge?
See the stocks on our ProPicks radar. These strategies gained 19.7% year-to-date.
Unlock full list

Crude’s Coming Collapse: 5 Reasons Oil Will Fall To $25 In 2016

Published 11/16/2015, 12:04 AM
Updated 09/02/2020, 02:05 AM

By Jesse Cohen

Of late, oil market players have been grappling with one key question: are prices of the commodity in the process of bottoming, or will futures see a further collapse to new lows in 2016?

This past Friday, U.S. Crude futures ended the week at $40.70 a barrel, while Brent settled at $44.50. Just 18 months ago, in June 2014, a barrel of oil fetched more than $100.

So far in 2015, U.S. and Brent prices are down almost 18%. Dating back to June 2014, oil futures have lost approximately 60%. That’s a heart-stopping decline, and there’s no reason to believe it’s over yet.
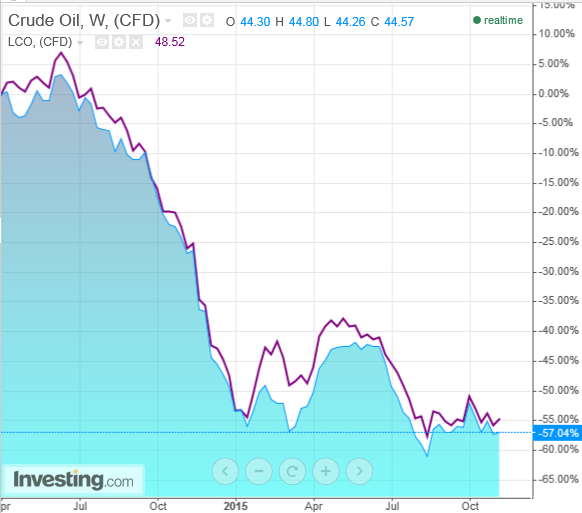
Crude Weekly YTD

Because of 5 bearish factors now dominating the market, I see oil prices falling even further in the coming year, to a range between $25-to-$35 a barrel.

1. Global oil production is outpacing demand following a boom in U.S. shale oil output and after a decision by the Organization of Petroleum Exporting Countries (OPEC) last year not to cut their supply quota (see chart, below). According to recent estimates, OPEC pumped approximately 31.64 million barrels a day in October, close to record-highs, as major producers led by Saudi Arabia focused on defending market share by keeping production high.
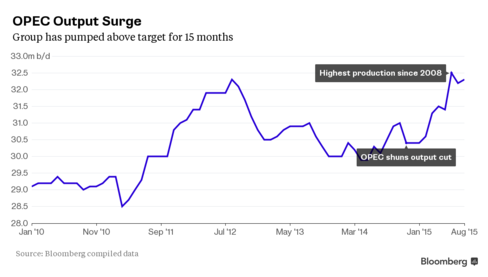
OPEC Output 2010-2015

2. OPEC supplies are expected to rise further once Iran begins boosting crude production when international sanctions are lifted early next year, following July’s nuclear agreement with major Western powers. Tehran wants to double oil exports to 2.3 million barrels a day by the middle of 2016, adding to the glut of oil that has already sent prices tumbling.

3. Worries over high domestic U.S. oil supplies, despite a declining rig count, will also pose a bearish risk for prices in the year ahead.

According to industry research group Baker Hughes (N:BHI), the number of rigs drilling for oil in the U.S. stood at 574 last week, remaining close to the lowest level since June 2010 (see chart, below). Over the prior 11 weeks, drillers in the U.S. have cut 101 rigs. Ironically, a lower U.S. rig count is usually a bullish sign for oil as it signals potentially lower production in the future.
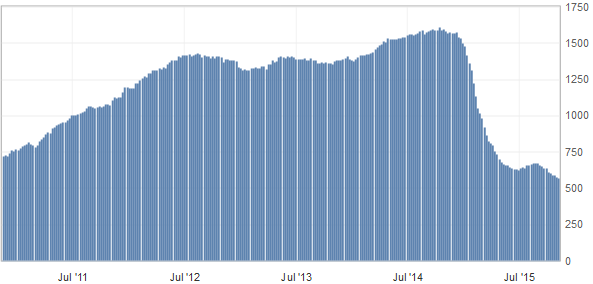
Baker Hughes Rig Count 2010-2015

However, U.S. oil production has held around 9.0 million barrels a day for the past year, close to the highest level since the early 1970s. At the same time, total U.S. crude oil inventories stood near levels not seen for this time of year in at least the last 80 years.
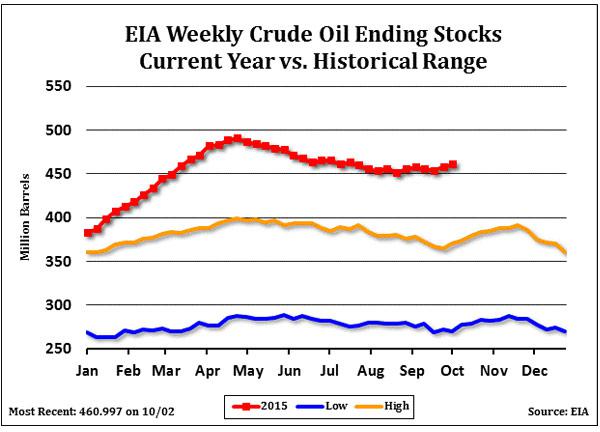
EIA Weekly Crude Oil Stocks YTD vs Historical Range

4. Adding to the bearish sentiment, ongoing worries over the weakening health of the global economy have fueled concerns that a global supply glut may stick around for longer than anticipated.

Widespread concerns over the soundness of China's sluggish economy and its impact on oil demand will remain a factor. The Asian nation is on track to post its weakest annual growth rate since the global financial crisis in 2015.

China’s third quarter GDP growth came in at 6.9%, just below the government’s 7% target. Industrial production figures, announced this past Wednesday, missed expectations and are clearly slowing; Fixed asset investment has flattened. As analyst Cam Hui points out, China's traditional growth engine—powered by industrial exports and infrastructure spending—"is decelerating along a number of dimensions."

China's implied oil demand slowed to 226,500 barrels a day in September, the weakest growth rate over the last 8 months. The Asian nation is the world's second largest oil consumer after the U.S. and has been the driver of strengthening demand.
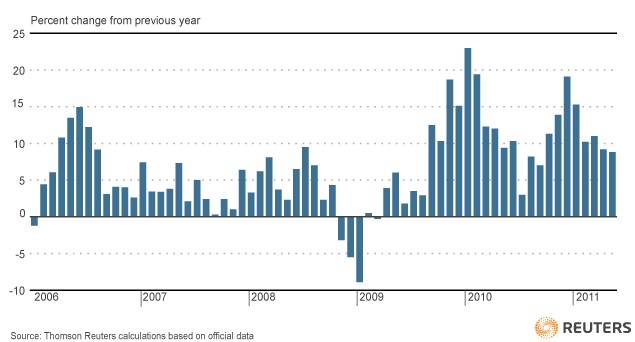
China Oil Demand: 2006-2015

5. Oil prices will also face headwinds from a stronger U.S. dollar once the Federal Reserve starts hiking interest rates and tightening monetary policy. The policy shift, which many anticipate will be announced in December, is expected to boost the dollar and make dollar-denominated oil futures contracts more expensive for buyers who use other currencies.

All these factors indicate that a rebalance in supply and demand is distant, insuring that oil prices will stay low for a long time.

Technical analysis further supports this view. After breaking below a trend line dating back to 1999, bearish chart signals show there is no clear support until prices reach the $25-to-$30-level.
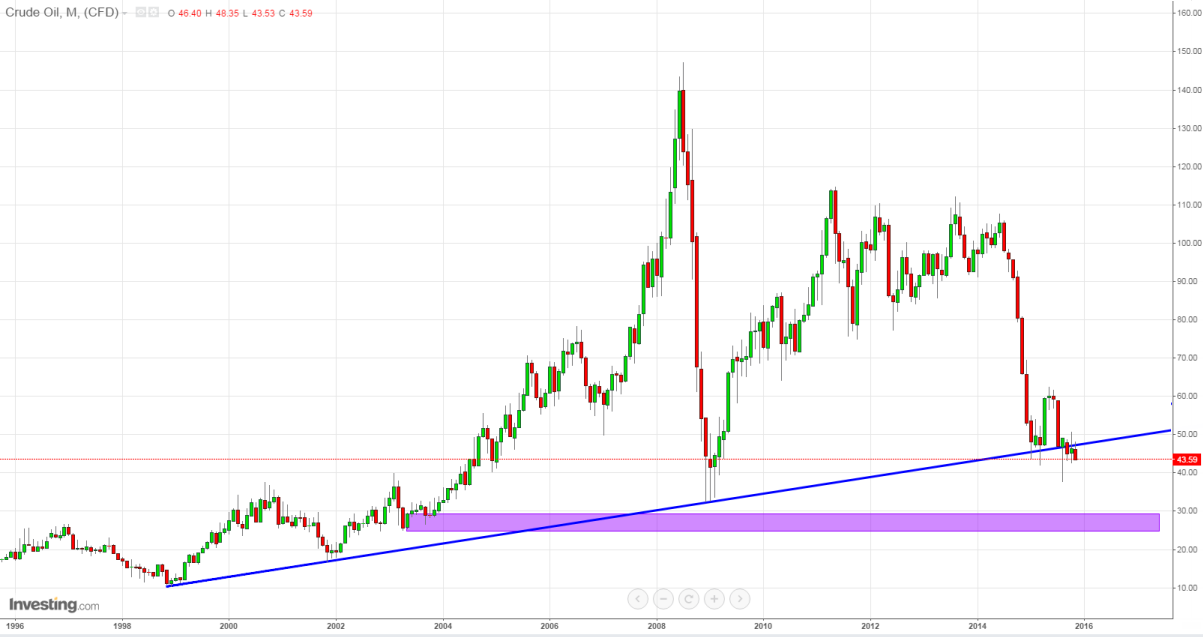
Crude Oil Monthly 1996-2015

Based on the numerous fundamental and technical signals currently flashing across the broader economic spectrum, I believe oil prices will continue to spiral lower, likely bottoming at $25 a barrel in 2016.

Latest comments

Good call. What's your prediction for 2017?
OPEC's strategy of sinking competitors by perpetuating this low price environment appears to have limited effects as it has only decreased US oil production by 500,000 barrels a day when we're at 9,000,000 barrels a day.
Your 5 points are all known news for months already, I don't see anything new here.. 1. Global supply outpacing demand. 2. Iran factor.. 3. US factor.. 4. Global growth including China slowdown.. 5. Stronger USD.. . Sure price can keep falling, but as price decline, shorts are taking increasing Risks with poorer Rewards. For those with longer time horizon, being Long, at the right timing, will have better Rewards to Risks. Never catch a falling knife, but once the bottom is in, be on the long side and hold.
Excellent article, thanks. As a technical trader, I especially like the last chart that shows retesting and breaking of the trend-line on the monthly chart. This is a bearish signal, and unless the price closes above it again soon, the direction is clearly down towards the demand zone below (as marked with a purple rectangle.)
A great fight between the bulls & bears at the $40-$41 range before the expiration.. An expiration of the December contract below $40 would be simply lovely!.
Maybe, but probablly won't happen.. . So bears will have to unload this tankers that were brought to US ports to cover short positions for litle higher price as thez would like to be.. . Anyway also 40-41 is very low.. . It will be interesting to look next week oil future statistic.. . Probablly all long before OPEC meeting with ex-bears in first line.. . . . .
Oil price should be $3 per barrel that is the fair value of Oil.
Entire bear party here.. . Guys I would recomend you to pump oil by yourseleves and sell it for 10$.. . Article is total miss.. . 1. china consumption grow by 10% year. 2. Oil reserves are deplted by 10% year so every year need to be prepared 4M bbl/day and CAPEX was just cut to not reach that. . We will soon see oil at 60$ and if CAPEX won't improve back to 100$. . So it goes..
China consumption growing? I'm wouldn't bet on that for long with their economy showing signs of significant weakness.
What weakness? They have rise of GDP 6.7%. And US how much.. Beside that oil consumption is not elastic. They have every year more cars and they will use them.. What else you would expect?. Cars in garage and walking by foot.
At this pace oil prices will reach $25 by next month..
Not so fast. $40 will not be broken so easily
Will $40/barrel will be broken finally today just before Dec. contract expiration??? :)
Well written!. The greatest challenge will be around $35-$37.. RSI @29 might actually support the acceleration of the downtrend
Risk Disclosure: Trading in financial instruments and/or cryptocurrencies involves high risks including the risk of losing some, or all, of your investment amount, and may not be suitable for all investors. Prices of cryptocurrencies are extremely volatile and may be affected by external factors such as financial, regulatory or political events. Trading on margin increases the financial risks.
Before deciding to trade in financial instrument or cryptocurrencies you should be fully informed of the risks and costs associated with trading the financial markets, carefully consider your investment objectives, level of experience, and risk appetite, and seek professional advice where needed.
Fusion Media would like to remind you that the data contained in this website is not necessarily real-time nor accurate. The data and prices on the website are not necessarily provided by any market or exchange, but may be provided by market makers, and so prices may not be accurate and may differ from the actual price at any given market, meaning prices are indicative and not appropriate for trading purposes. Fusion Media and any provider of the data contained in this website will not accept liability for any loss or damage as a result of your trading, or your reliance on the information contained within this website.
It is prohibited to use, store, reproduce, display, modify, transmit or distribute the data contained in this website without the explicit prior written permission of Fusion Media and/or the data provider. All intellectual property rights are reserved by the providers and/or the exchange providing the data contained in this website.
Fusion Media may be compensated by the advertisers that appear on the website, based on your interaction with the advertisements or advertisers.
© 2007-2024 - Fusion Media Limited. All Rights Reserved.