Initial Reaction
Once again we see the pattern of a strong establishment survey but a poor household survey. The latter varies more widely, and the tendency is for one to catch up to the other, over time. The question, as always, is which way?
Here is one stat that really stands out: The unemployment rate for teenagers 16-19 fell 1.7 percentage points. BLS Jobs Statistics at a Glance
- Nonfarm Payroll: +295,000 - Establishment Survey
- Employment: +96,000 - Household Survey
- Unemployment: -274,000 - Household Survey
- Involuntary Part-Time Work: -175,000 - Household Survey
- Voluntary Part-Time Work: +15,000 - Household Survey
- Baseline Unemployment Rate: -0.2 at 5.5% - Household Survey
- U-6 unemployment: -0.3 to 11.0% - Household Survey
- Civilian Non-institutional Population: +176,000
- Civilian Labor Force: -178,000 - Household Survey
- Not in Labor Force: +354,000 - Household Survey
- Participation Rate: -0.1 at 62.8 - Household Survey
January 2015 Employment Report
Please consider the Bureau of Labor Statistics (BLS) November 2014 Employment Report.
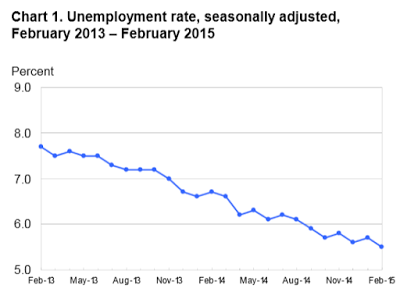
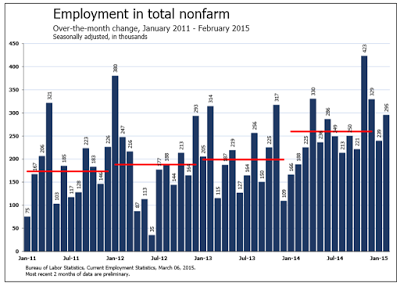
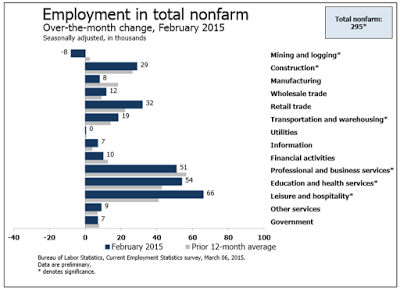
Total nonfarm payroll employment increased by 295,000 in February, and the unemployment rate edged down to 5.5 percent, the U.S. Bureau of Labor Statistics reported today. Job gains occurred in food services and drinking places, professional and business services, construction, health care, and in transportation and warehousing. Employment in mining was down over the month.
Click on Any Chart in this Report to See a Sharper Image
Unemployment Rate - Seasonally Adjusted
Nonfarm Employment January 2011 - February 2015
Nonfarm Employment Change from Previous Month by Job Type
Hours and Wages
Average weekly hours of all private employees was stationary at 34.6 hours. Average weekly hours of all private service-providing employees was flat at 33.4 hours.
Average hourly earnings of production and non-supervisory private workers was flat at $20.80. Average hourly earnings of production and non-supervisory private service-providing employees was flat at $20.61.
Since November, Average hourly earnings of production and non-supervisory private workers rose $0.03, from $20.77 to $20.80 (about a penny a month).
Since November, average hourly earnings of production and non-supervisory private service-providing employees rose $0.04 from $20.57 to $20.61 (about 2 cents a month).
From this perspective, wages are rising about 1% a year.
For discussion of income distribution, please see What's "Really" Behind Gross Inequalities In Income Distribution?
Birth Death Model
Starting January 2014, I dropped the Birth/Death Model charts from this report. For those who follow the numbers, I retain this caution: Do not subtract the reported Birth-Death number from the reported headline number. That approach is statistically invalid. Should anything interesting arise in the Birth/Death numbers, I will add the charts back.
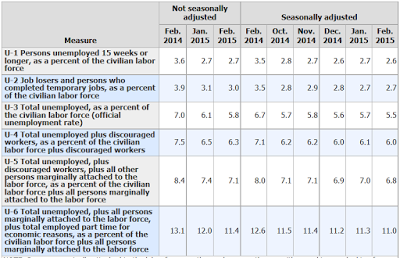
Table 15 BLS Alternate Measures of Unemployment
Table A-15 is where one can find a better approximation of what the unemployment rate really is.
Notice I said "better" approximation not to be confused with "good" approximation.
The official unemployment rate is 5.5%. However, if you start counting all the people who want a job but gave up, all the people with part-time jobs that want a full-time job, all the people who dropped off the unemployment rolls because their unemployment benefits ran out, etc., you get a closer picture of what the unemployment rate is. That number is in the last row labeled U-6.
U-6 is much higher at 11.0%. Both numbers would be way higher still, were it not for millions dropping out of the labor force over the past few years.
Some of those dropping out of the labor force retired because they wanted to retire. The rest is disability fraud, forced retirement, discouraged workers, and kids moving back home because they cannot find a job.
