I’m going to take a different tack today and examine the reasons why the stock market will just keep marching higher. The old “here’s why the market is going to fall right about now” doesn’t seem to be holding much water lately.
Before doing so, I must point out that the world right now is a contrarian’s dream (notwithstanding the fact that the market simply refuses to go lower. Ever.) Look no farther than this week’s Barron’s, which states that the market won’t crash (and I’m not making this up) for another thirty or forty years.
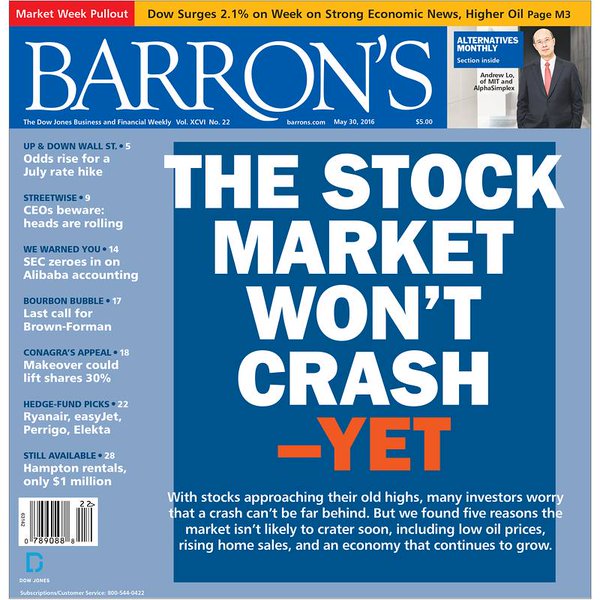
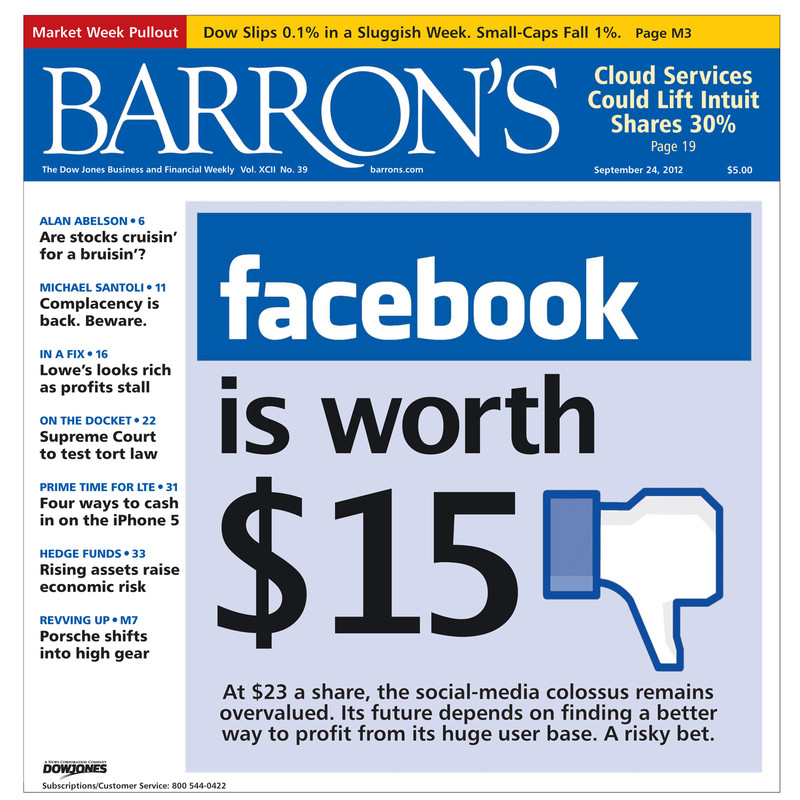
Observant stock market watchers long ago made the connection that Barron’s covers are to be faded, and that just doesn’t go for bullish predictions. Let’s not forget this gem from many hundreds of percent ago……
And this week we also had the almost surreal event of Janet Yellen being awarded a medal – – a medal, for God’s sake – – to honor her world-saving efforts. This was no minor honor, either, coming from none other than Harvard, the most prestigious university on the planet. Just look at her beam! I will remind a perhaps incredulous readership that this person did, in fact, reproduce.
Before I seduce myself into another doom-declaring prophecy, let’s step back and examine why the bears (like, say, me) are fools are the market will, in fact, keep vaulting higher.
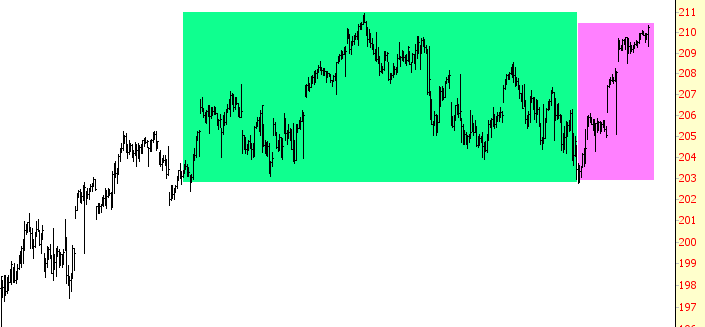
First up is the S&P 500 intraday chart. Up until last Thursday, this was gloriously positioned to begin some real downside action. This was aborted. There’s no better word for it. (Think of Kay Corleone describing something evil and unholy). The magenta shows how what in a normal market would have blossomed into a big downturn instead become nothing more than a pinned range. Heartbreaking.
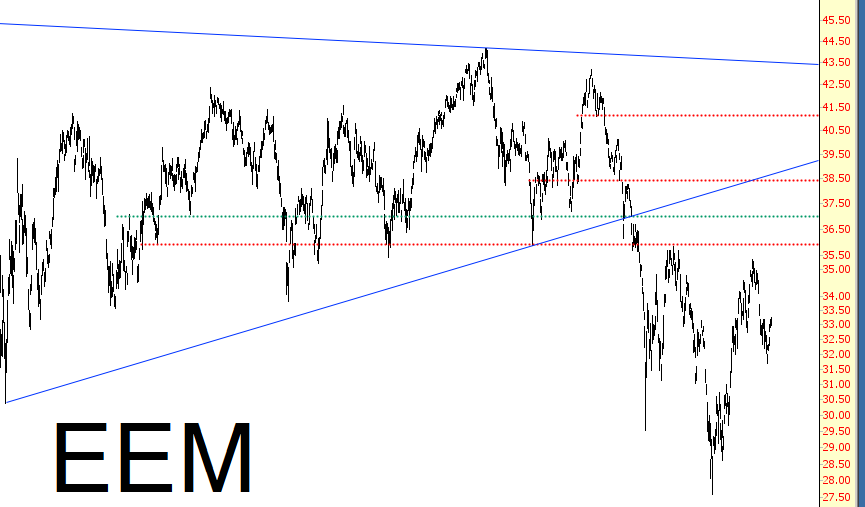
The emerging markets (via iShares MSCI Emerging Markets (NYSE:EEM)) look poised to potentially complete an inverted head and shoulders pattern and, subsequent to that, vault back up to the big blue trendline.
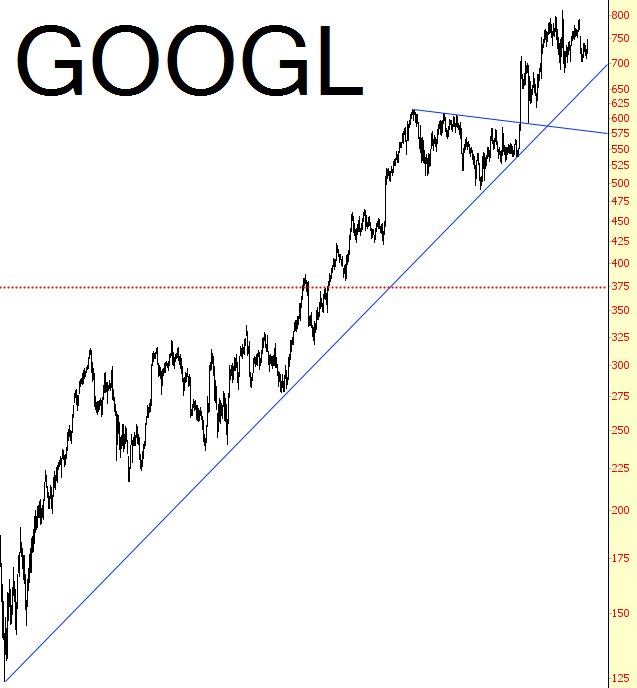
Many household name stocks look a lot like Google (oh, sorry, Alphabet (NASDAQ:GOOGL)………..sheesh) below.
That is, steady, consistent pushes higher, month to month, year to year. Facebook (NASDAQ:FB), Amazon (NASDAQ:AMZN), and all those other favorites have been minting fortunes for years, and there’s nothing about a chart like this to indicate that’s about to change anytime soon.
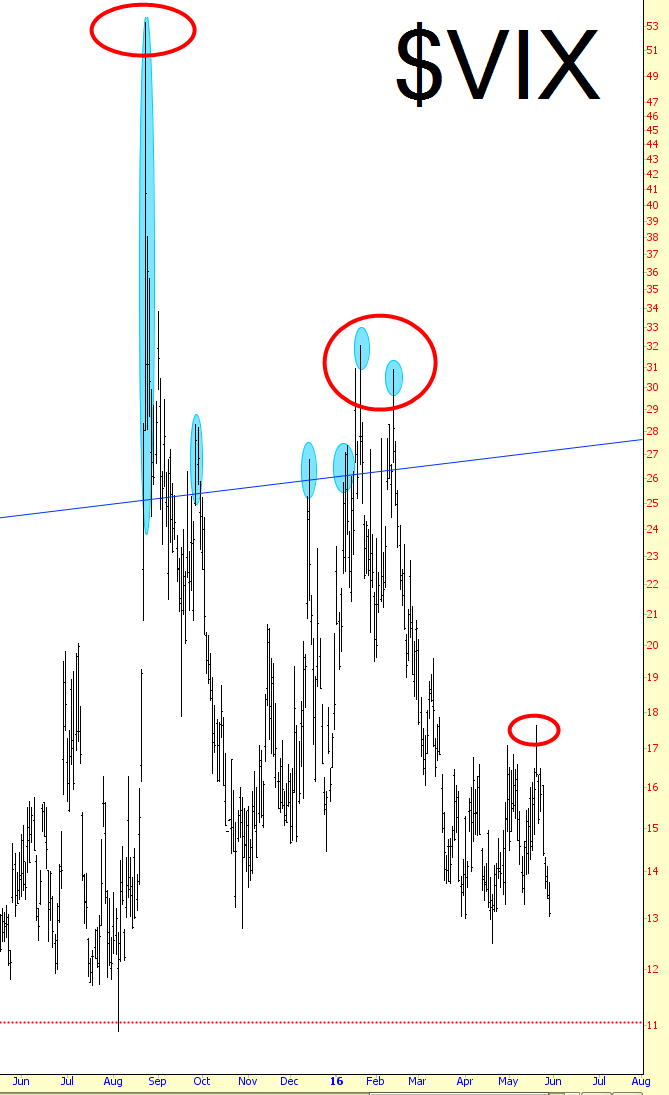
Plus volatility has been smothered to death. it wasn’t that many months ago we had a VIX approaching 60 (can you even believe that?) Now we’re virtually beneath the teens, for God’s sake. Fear has completely left the building, and the present-day version of a huge VIX surge that demands global intervention is anything above twenty.
Perhaps most troubling of all is this: the market seems to have gotten over its fear of high interest rates. If you’ll look back to the December 29th-January 20th market rout, everyone pointed to the Fed’s mid-December decision to hike rates. “The market can’t handle even this tiny increase”, we all agreed.
Well, this last “hope” of the bears seems to have been dispatched as well. When asked the question about whether interest rates were going to keep rising, Yellen responded this week, “You bet your ass.” Well, not in those exact words, but close. What did the market do? It lurched to nearly lifetime highs, that’s what!
What “should” be happening is a market falling to pieces, but it isn’t. Sure, now and then, we’ll get a little taste of weakness. Those first few weeks in January were like a tall glass of cool water in the middle of the desert. But I got fooled, because the desert is still there, the central bankers are winning, and the bulls are laughing all the way to the bank.
And consider this final thought: picture in your head – – Hillary and Bill Clinton marching up Pennsylvania Avenue in January as she prepares to take the reigns of the most powerful position on Earth. Honestly, take a moment, and picture that in your mind’s eye. Picture Bill with his giant smirk, waving to the crowds. Picture Hillary and her gargantuan ass swaying back and forth (come to think of it, only Carter did the walk; they’ll be toted around in a bulletproof limo).
At that point, you’ll know the bad guys have wholly and fully won. Goldman Sachs (NYSE:GS). Lloyd. Bill. All of them. We’ve spent the past seven years thinking that the financial crisis was just Act One to a much bigger drama. Well, it wasn’t. Instead, the financial crisis was the last chance for America to save itself from itself. Instead, the 1% have utterly triumphed, a completely venal, corrupt woman is going to be escorted into the White House (mainly because women like the fact she is, clinically speaking, a female), and not a single bad boy on Wall Street will have paid any price for their sins.
Congratulations. This is what a passive public has wrought. And here we still are.
